AMD Ryzen 3DMark Physics Score Leaked
Samuel Wan / 7 years ago
![]()
Last week, we saw a variety of Ryzen benchmarks pop up. Some tests showed strong performance compared to Intel’s Skylake architecture while others exposed the weakness’s of AMD’s Zen design. So far, many of the tests have been about general performance or synthetics but now we have something more pertinent to gaming. Videozardz has managed to get ahold of some Ryzen results from 3DMark’s Firestrike physics test.
For the first time ever, we are getting scores not just for the octa-core flagship but also for the hexacore and quad-core models. We have the ZD3406BAM88F4_38/34_Y octa core, ZD3301BBM6IF4_37/33_Y hexacore and ZD3201BBM4KF4_34/32_Y quadcore. Luckily for us as well, Videocardz has also provided a nice breakdown for the per core score. Since 3DMark is decently multi-threaded, per score performance is critical to understanding the true performance in many games.
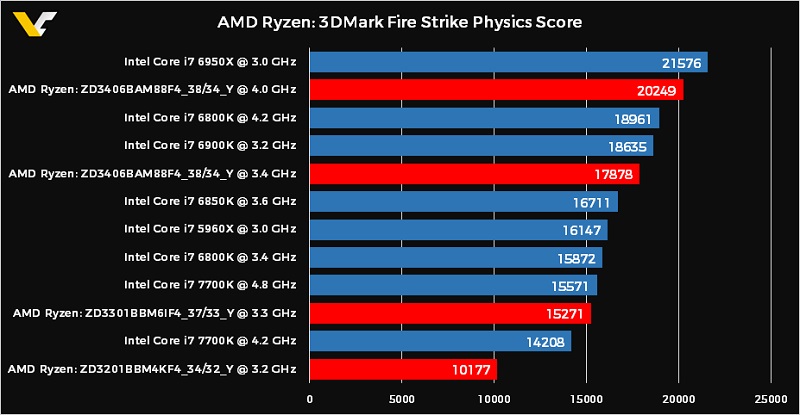
First up, we have the octacore Ryzen clocked at 3.4 GHz and 4.0 GHz scoring 17878 and 20249 respectively. These scores bracket the Intel octacore i7 6900K which is right where we expect them to be, Moving onto the hexacore, Ryzen scores 15271 clocked at 3.3 GHz, sitting just below the heaxcore i7 6800K at 3.4 GHz. Quadcore Ryzen fails to impress with only 10177 points which is well below the i7 770K due to its clock speed deficit but around where the i7 4770K scores. Overall, a strong showing from AMD’s Zen archiecture.
The real test for gaming, however, is the per core score and unfortunately, AMD falls a little bit behind. Interestingly, most of the Ryzen scores pools around the 2500 mark with the octa-core 3.4 GHz sitting below at 2235. Again, much of the differences are due to clock speed. The real surprise is that the 4 GHz octa core is not pulling ahead of the pack with it’s higher clock speed. Perhaps the scaling for AMD cores isn’t quite there yet or the other chips are boosting well beyond their stock clocks as well.
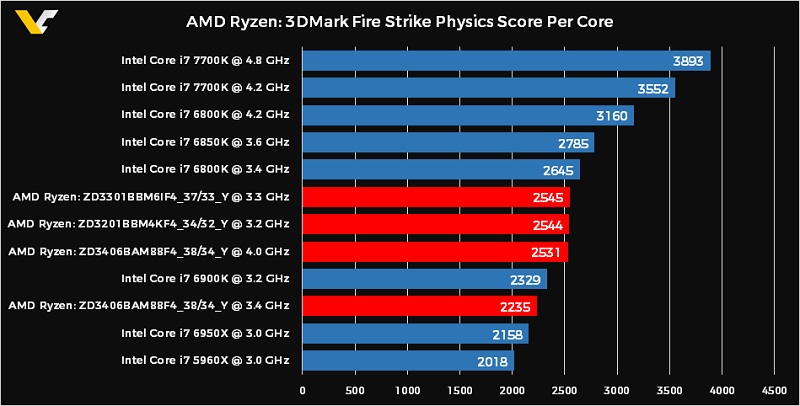
There is one cautionary note I would like to make about the per core scores. Videocardz divided up the raw scores by the real core count for each CPU to get the per core score. However, 3DMark runs the test with a thread for each available logical core, meaning HyperThreading and SMT are used. This means any losses AMD is due to a combination of the difference between the core architectures but also the efficiency of SMT vs HyperThreading. Since Intel has a lot more experience in this area and Zen is AMD’s first try, I expect much of apparent deficiencies of Zen are due to this effect.