Blitzwolf BW-D1 120GB SATA3 SSD Review
Bohs Hansen / 7 years ago
Introduction
Today is a little bit of a special day as it is the first time that we have a solid state drive from BlitzWolf in the office for some testing and benchmarks as well as a closer look. The BlitzWolf drive that I’m testing today is called the BW-D1 and it is a drive with 120GB capacity.
When most of us think of solid state drives, we think bigger these days and 120GB might not seem like a lot. However, that is not the case if we’re dealing with systems such as Home Theater PCs and similar systems that don’t require more storage than the operating system and media database takes. And that’s just where this drive could come in handy.
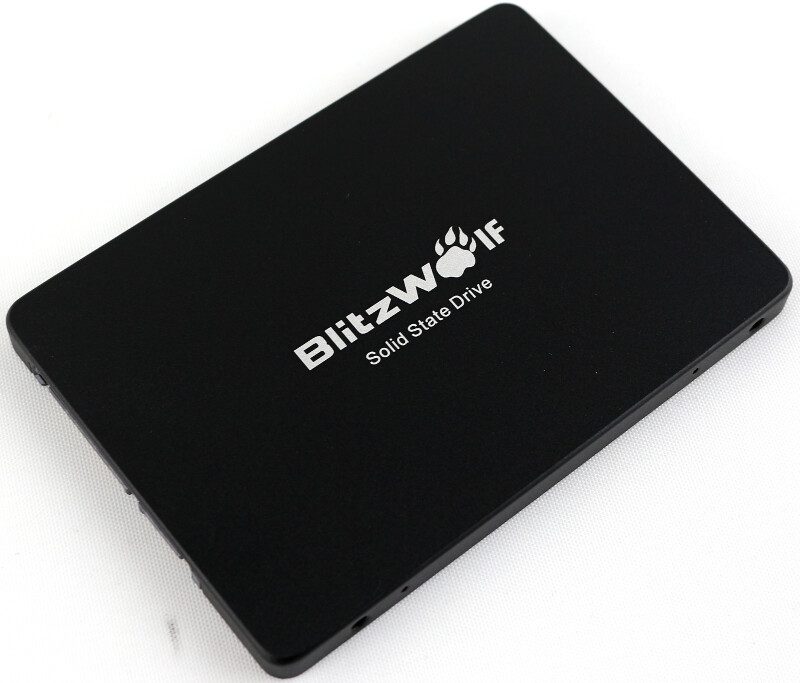
The BlitzWolf BW-D1 comes in a default 2.5-inch form factor with a 7mm drive height. That makes it compatible with almost any system these days. Whether you got a notebook or a stationary PC, an SFF system or something else, the BW-D1 will most likely fit.
Feature wise, the drive comes with the basics such as Trim, SMART, and RAID protection as well as ECC and wear leveling. That’s almost a complete set and we’re only missing some power saving features which it also features. The Device Sleep (DevSLEEP/DevSLP) function will put the drive into the lowest possible power setting when the system enters hibernation or sleep mode.
BlitzWolf pre-tests all their drives and that is a great service that isn’t common on lesser known brands such as this one. The drive is backed by an 18-month warranty which is slightly less than we’re used to here in the EU, but that’s because it comes out of Asia.
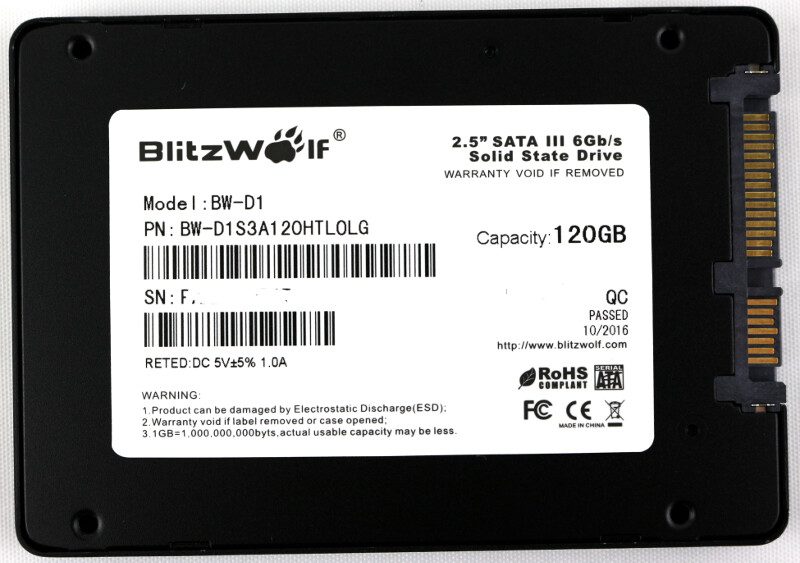
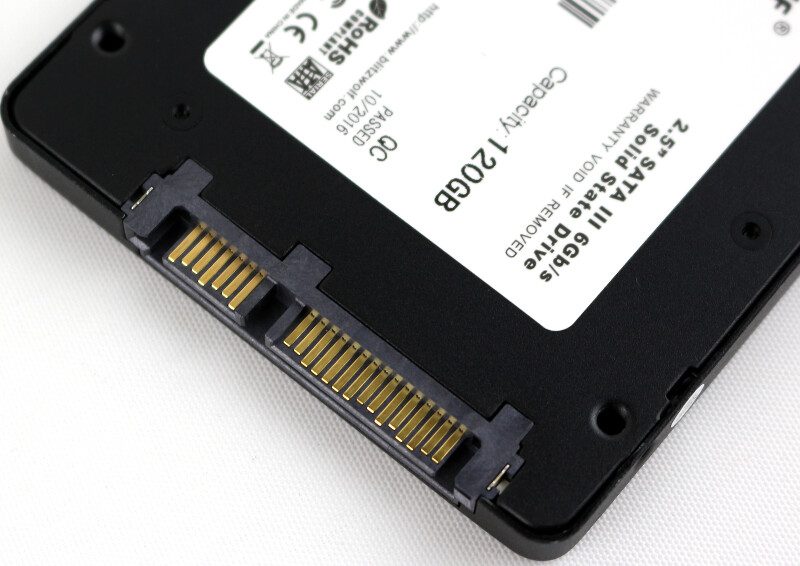
The default SATA3 connector allows the drive to connect with 6Gbps and it comes with performance ratings of up to 500MB/s when reading and 400MB/s when writing.
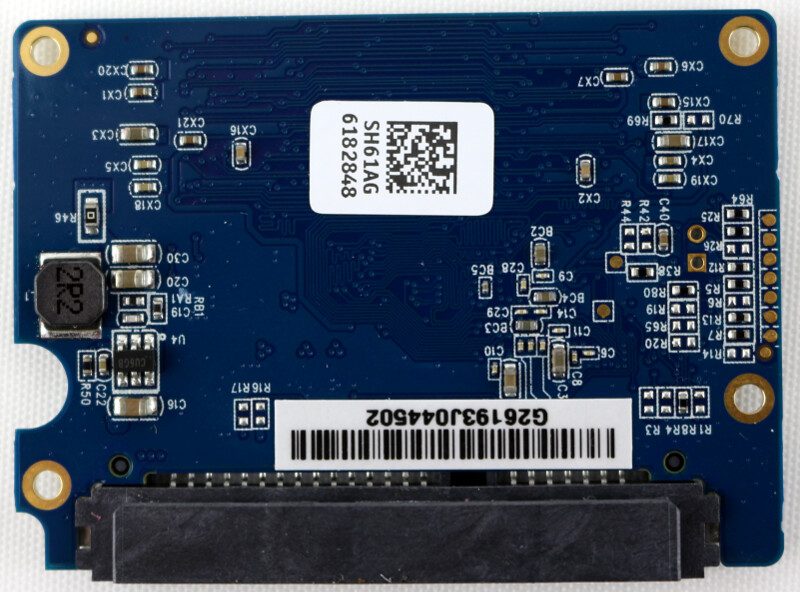
We find a very small PCB on the inside of the drive that’s barely wider than the SATA connectors themselves. Here we can see that the Marvell 88NV1120 controller handles our operations and that’s also the reason for all the previously mentioned SSD features.
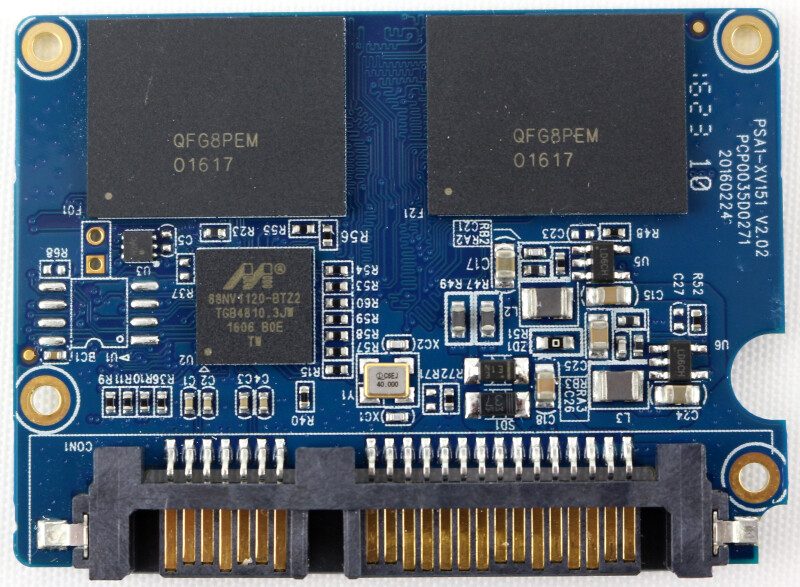
Other than that, it’s a very simple drive with just two TLC NAND chip packages and not much else.
Feature Highlights
- 6Gbps SATA-Ⅲ interface
- 500MB/S Read Speed
- ECC, Wear leveling, TRIM, S.M.A.R.T and RAID Protection
- DevSleep (Device Sleep) Mode
- 18-Month Warranty
- Marvell 88NV1120 Controller with TLC NAND
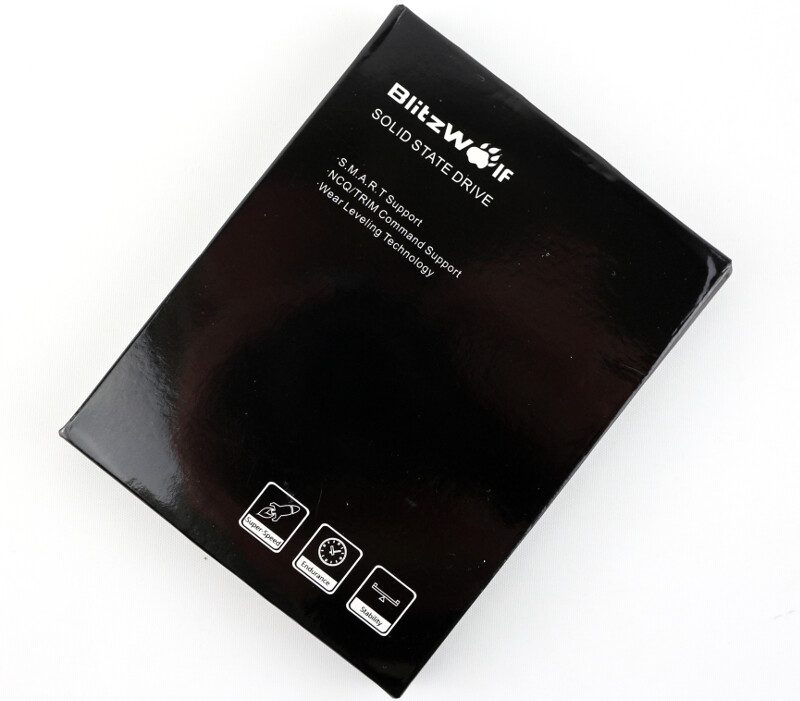
Package and Content
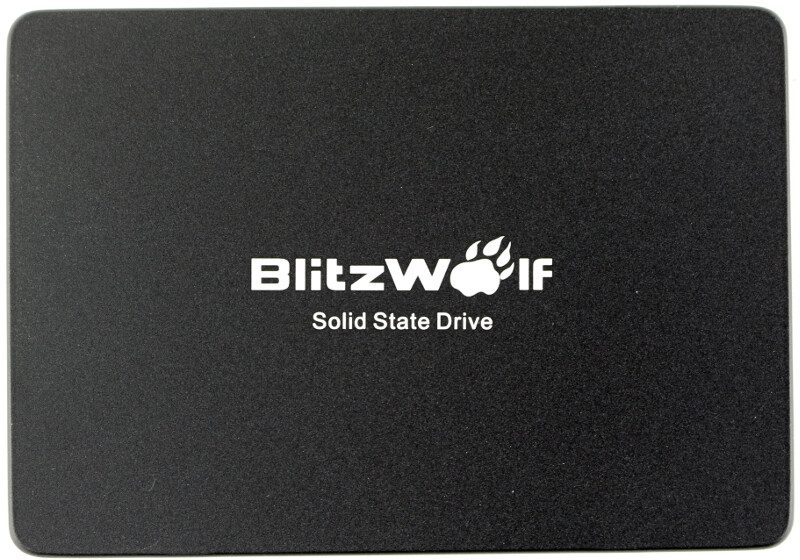
The package is as simple as it gets. A black box that displays the main features right on the front.
The rear of the box has a little more information, but not much. Then again, it’s an SSD, so what information do you want?
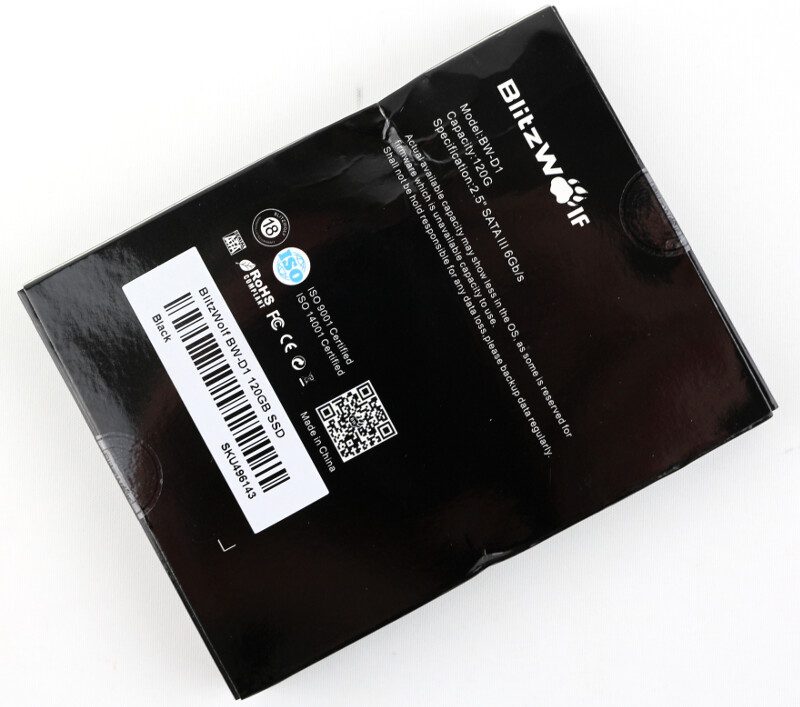
Inside are a small user manual and warranty guide along with the drive itself.
Testing & Methodology
Hardware
- Gigabyte Z79X UD5H-BK
- Intel Core i7-4790K
- G.Skill Ares DDR3 1866MHz (2x4GB)
- OCZ Vertex4 256GB
- CoolerMaster Silent Pro Hybrid 850W
- NZXT Kraken X60
- Dimastech Easy V3
Software
- AIDA64 Storage Benchmark
- Anvil’s Storage Utilities
- AS SSD Benchmark
- ATTO Benchmark
- CrystalDiskMark
- IOMeter
- PCMark 8 Storage Benchmark
- Windows 10
In a bid to make our testing as thorough and as accurate as possible, we have devised a testing methodology that will give us the maximum amount of data. Whilst this means that testing each drive will take considerably longer – easily up 36 hours – the overall picture that we can gather from this helps us and you as the reader to gain a clearer picture of the drive’s overall performance, strengths, and weaknesses and it provides a more accurate analysis at each drive performs under different conditions.
There are many ways to test a storage drive and we have chosen to include close to every test possible. We will start with a normal benchmark analysis of the formatted drive with various fillage scenarios. Depending on how a drive is built, it might perform differently depending on how much data it already is storing. To test this, the drive will be tested empty as well as with 25%, 50%, and 75% space usage. For these tests, we will be using Anvil’s Storage Utilities, AS SSD Benchmark, ATTO Benchmark, and CrystalDiskMark. Besides these synthetic fill tests, the drive will also be tested with PCMark 8’s storage benchmark in order to get real-world performance results.
Following the fillage tests, the partition will be removed and we test the drive’s raw performance. These tests will determine the hardware’s capabilities while removing any interference from the set file system. AIDA64’s storage benchmark and IOmeter are both great tools for this and they help us paint an even clearer picture of the drive. The IOmeter tests I run are quite different from the rest as they will give a final result after a longer performance test rather than a maximum or average score. This gives us yet another view of the tested drive over the ordinary tests.
Durability is a vital factor when it comes to NAND-based drives as the chips only can be rewritten so many times before they’ll stop working properly. Modern SSDs come with wear-level algorithms to increase the lifetime and reduce this factor as much as possible. We also take this into consideration in our reviews even tho it would take years to simulate this under real-world conditions. Luckily, Anvil’s Storage Utilities comes with an endurance test that can perform this action much faster, but it is still a time-consuming process. process. Depending on the hardware, this can easily take several days and we write thousands and thousands of small files in various sizes and compressibility to drive over and over.
Following this conditioning process, all of the previous benchmarks will be run again in the same scenarios and in the same order. This will give us a great view on how a drive will perform after prolonged usage and that is a very vital factor when you pick out your storage drive.
Modern operating systems all take care of the TRIM command in the background and it isn’t something normal users need to worry about. However, For these reviews, I will add a waiting period between each benchmark to make sure that the TRIM command has been fully executed and finished. After all, we want a clear picture of the drive’s performance with minimal interference from the operating system.
On each page that follows with the benchmark results, I have inserted result screenshots from the benchmarks, created drive analysis chart for the fill-level performance, and added drive comparison charts where possible.
AIDA64
AIDA64 is a streamlined Windows diagnostic and benchmarking software for home users. It provides a wide range of features to assist in overclocking, hardware error diagnosis, stress testing, and sensor monitoring.
It has unique capabilities to assess the performance of the processor, system memory, and disk drives and is compatible with most Microsoft Windows operating systems. It also has a disk benchmark tool, and that is the one I’ll be using.
Fresh Drive
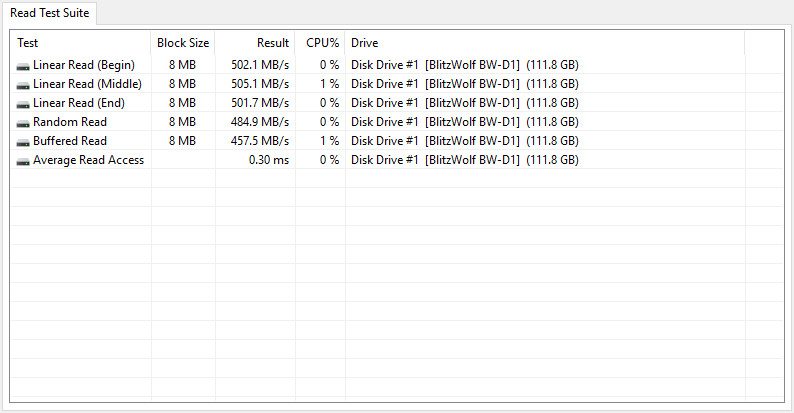
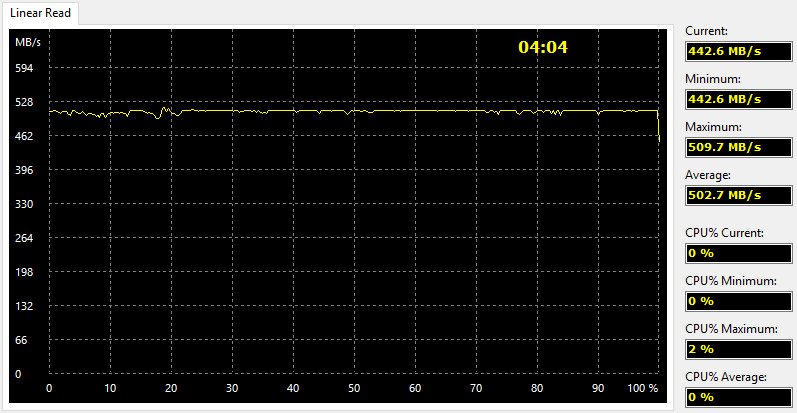
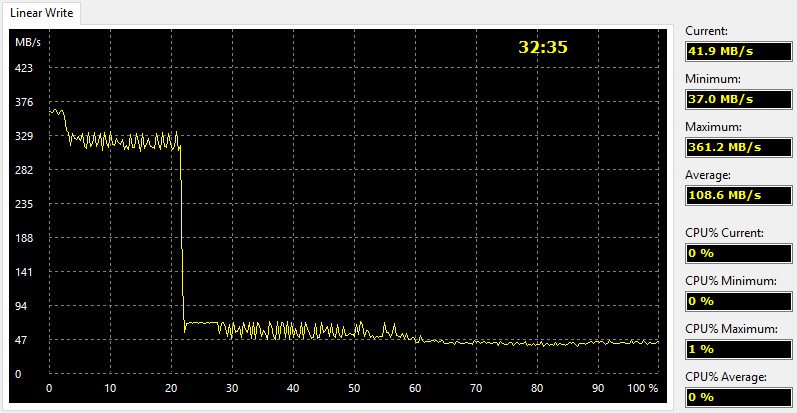
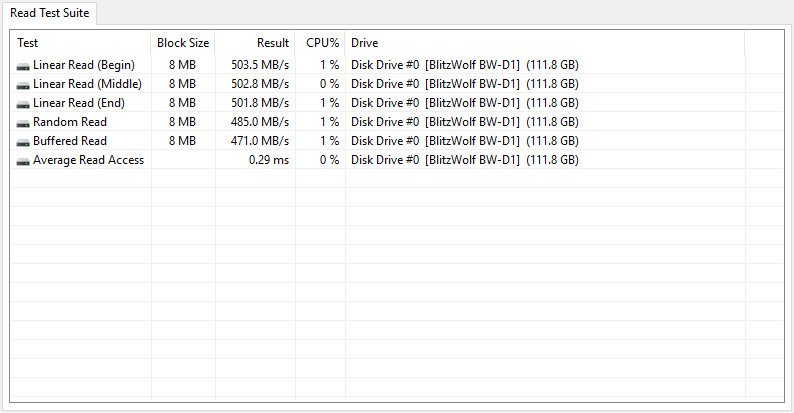
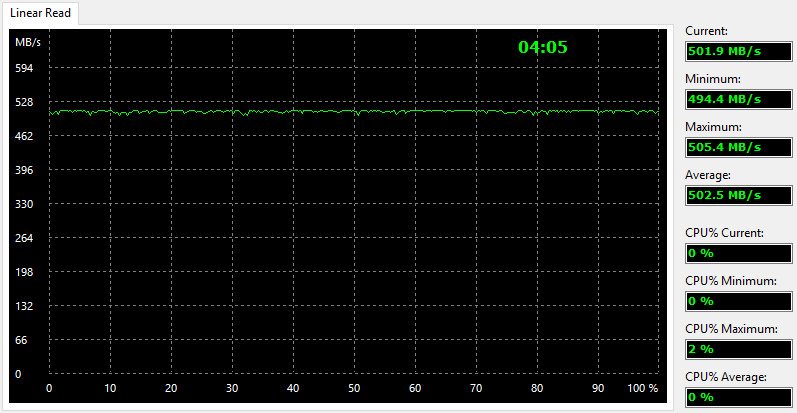
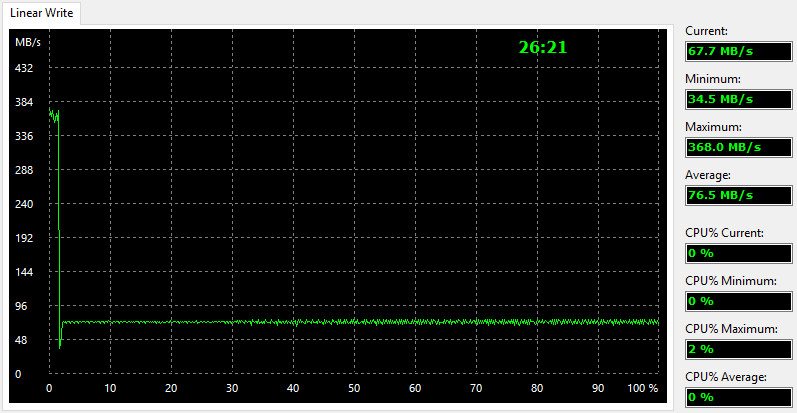
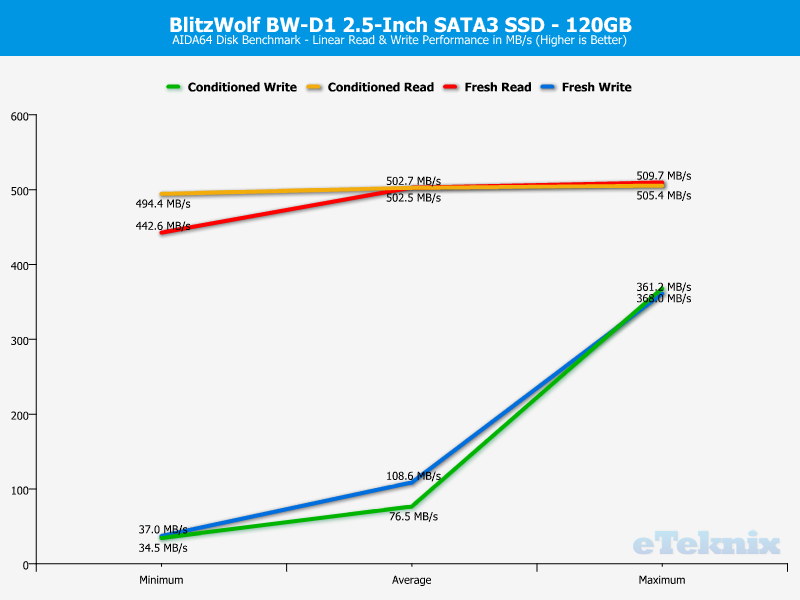
The Linear Read and Write tests measure the sequential performance by reading or writing all sectors without skipping any. It gives, as the name says, a linear view of the drives overall performance from start to end.
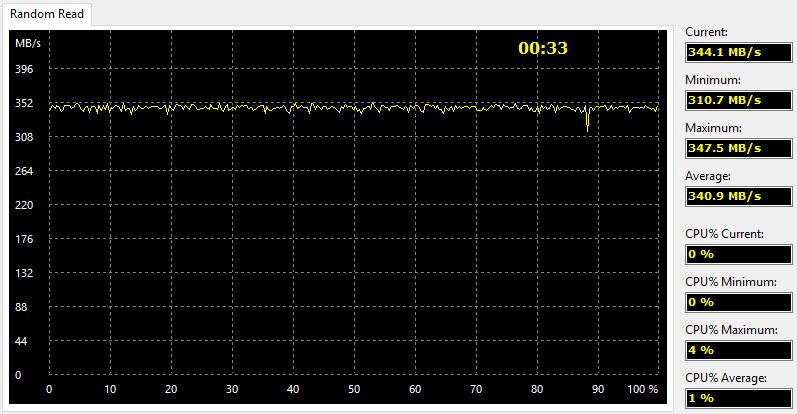
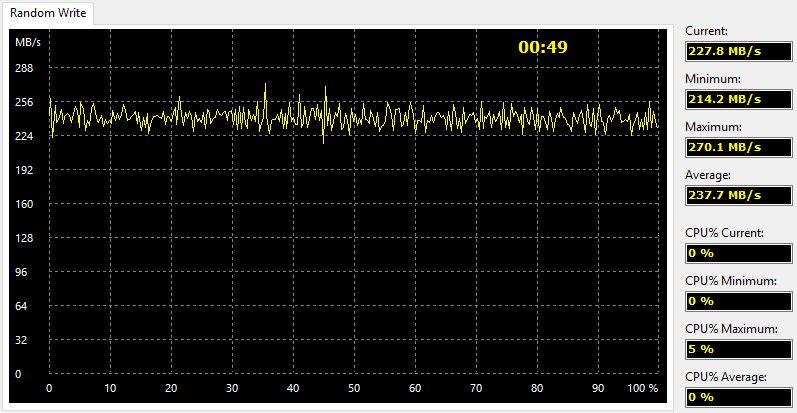
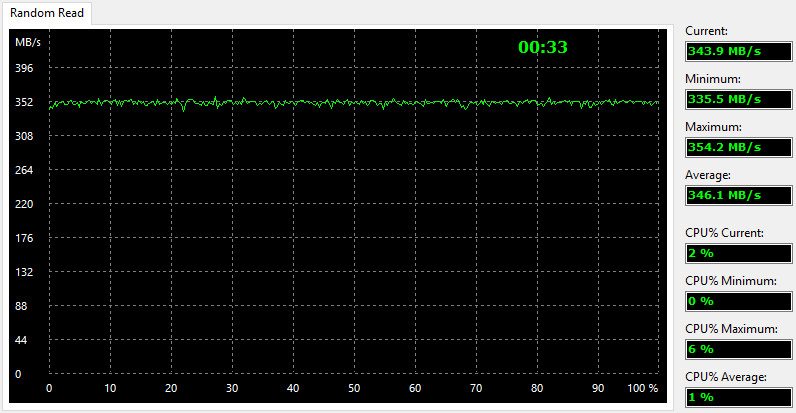
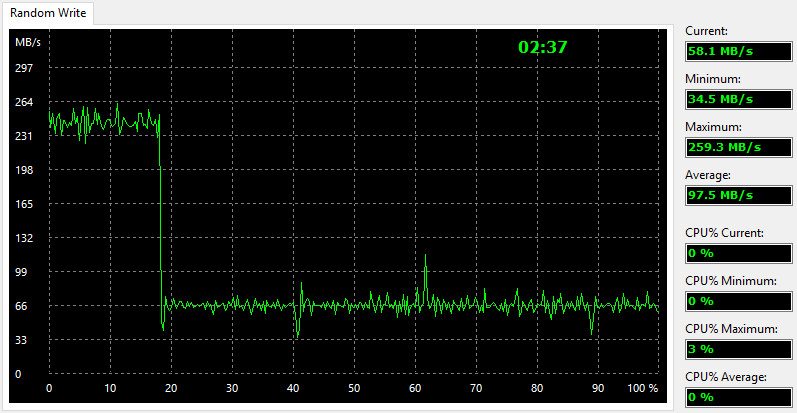
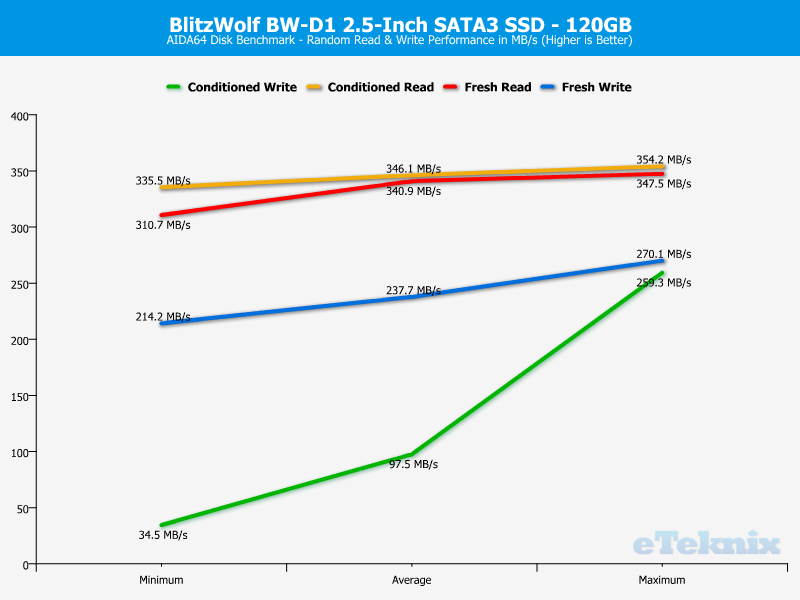
The Random Read and Write tests measure the random performance by reading or writing variable-sized data blocks at random locations on the surface of the drive. The Random tests are actually a combination of both speed and access times as it moves the position before each new operation.
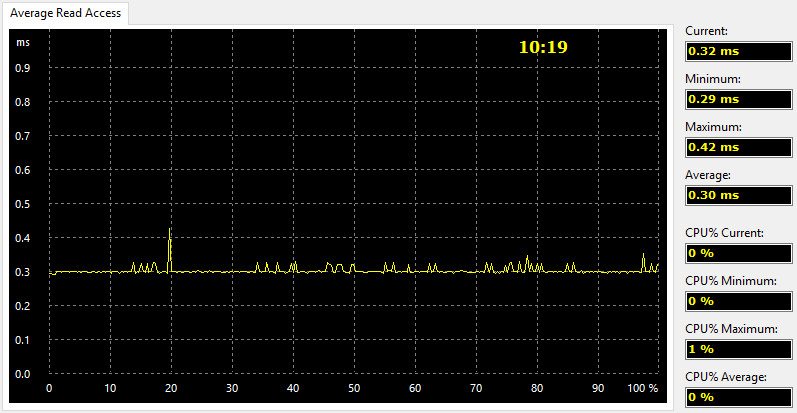
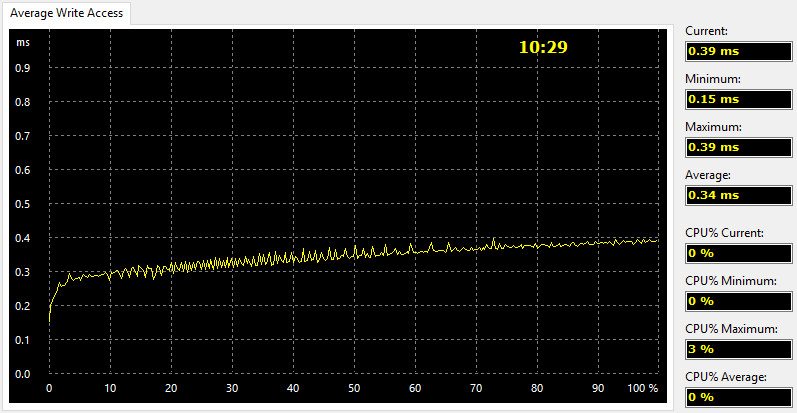
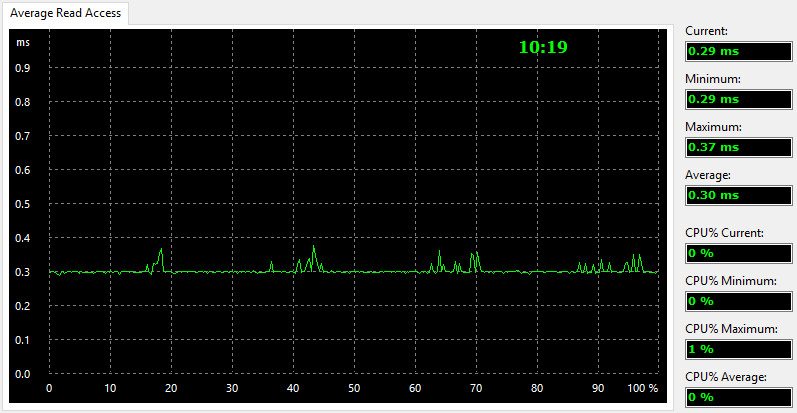
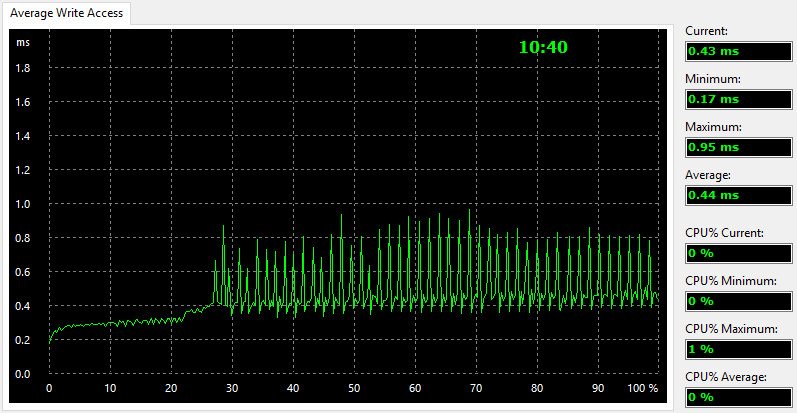
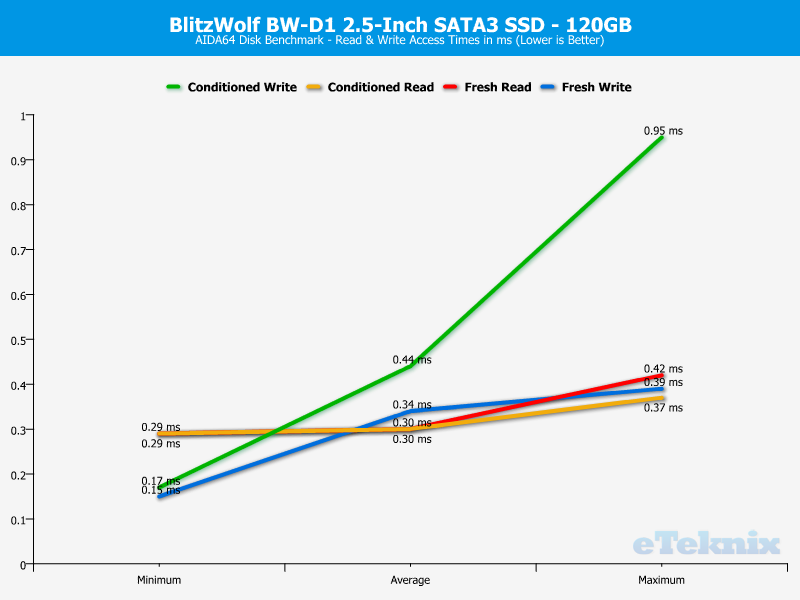
The Access time tests are designed to measure the data access performance by reading or writing small 0.5KB data blocks at random locations on the drive surface.
Conditioned Drive
The Linear Read and Write tests measure the sequential performance by reading or writing all sectors without skipping any. It gives, as the name says, a linear view of the drives overall performance from start to end.
The Random Read and Write tests measure the random performance by reading or writing variable-sized data blocks at random locations on the surface of the drive. The Random tests are actually a combination of both speed and access times as it moves the position before each new operation.
The Access time tests are designed to measure the data access performance by reading or writing small 0.5KB data blocks at random locations on the drive surface.
Performance Analysis
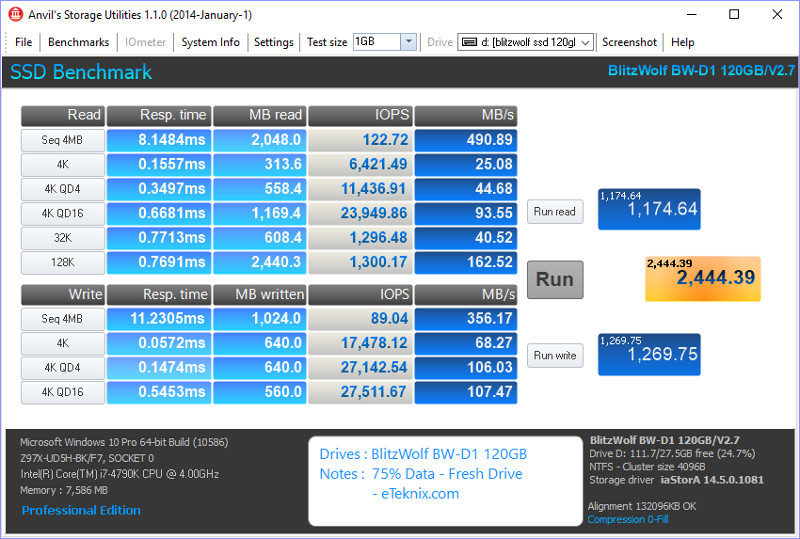
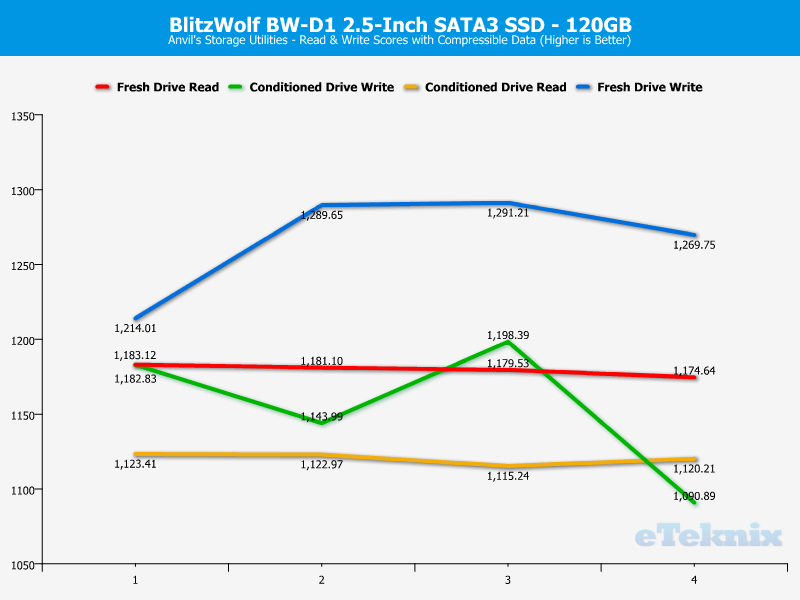
Anvil’s Storage Utilities
Anvil’s Storage Utilities is a new benchmarking utility that we have started using here at eTeknix, it’s completely free to download and has the ability to test mainly hard drives and solid state drives, but also any other form of storage medium that you can throw at it.
As well as testing the drive in a variety of benchmarking tests, it also has a drive endurance test that consistently reads and writes data to the selected medium to give days, months and potentially even years of use in a shorter period of time to see how the drive copes in the longer term.
Fresh Drive
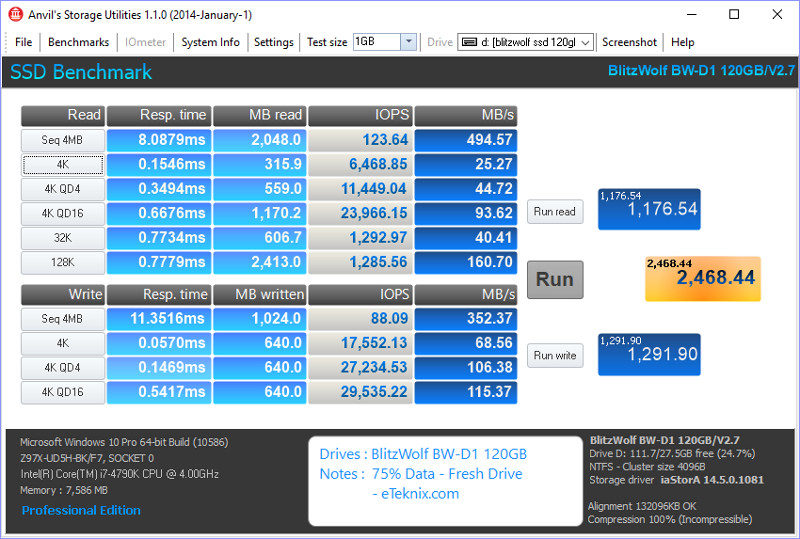
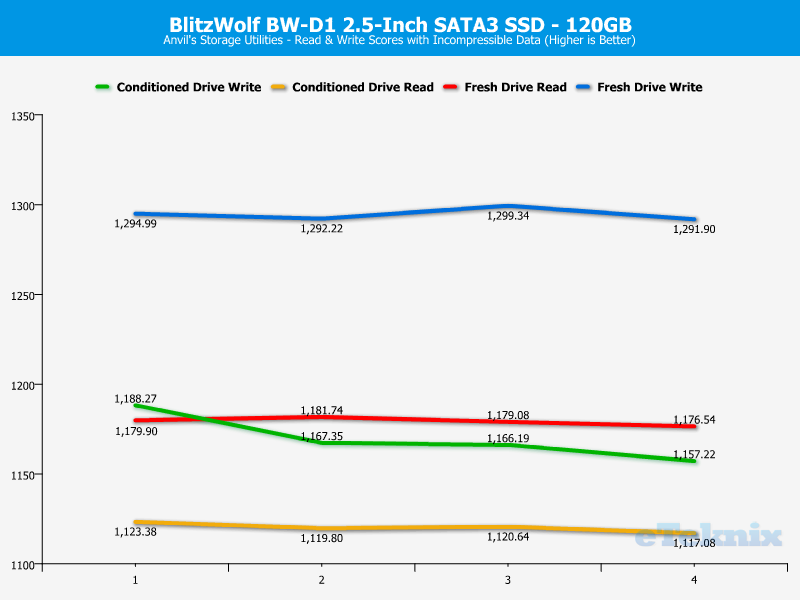
Conditioned Drive


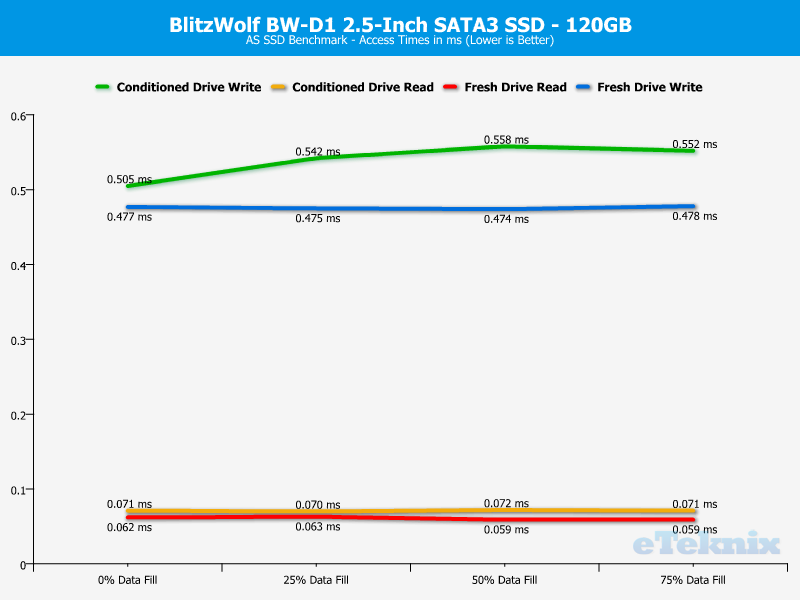
Drive Performance Analysis
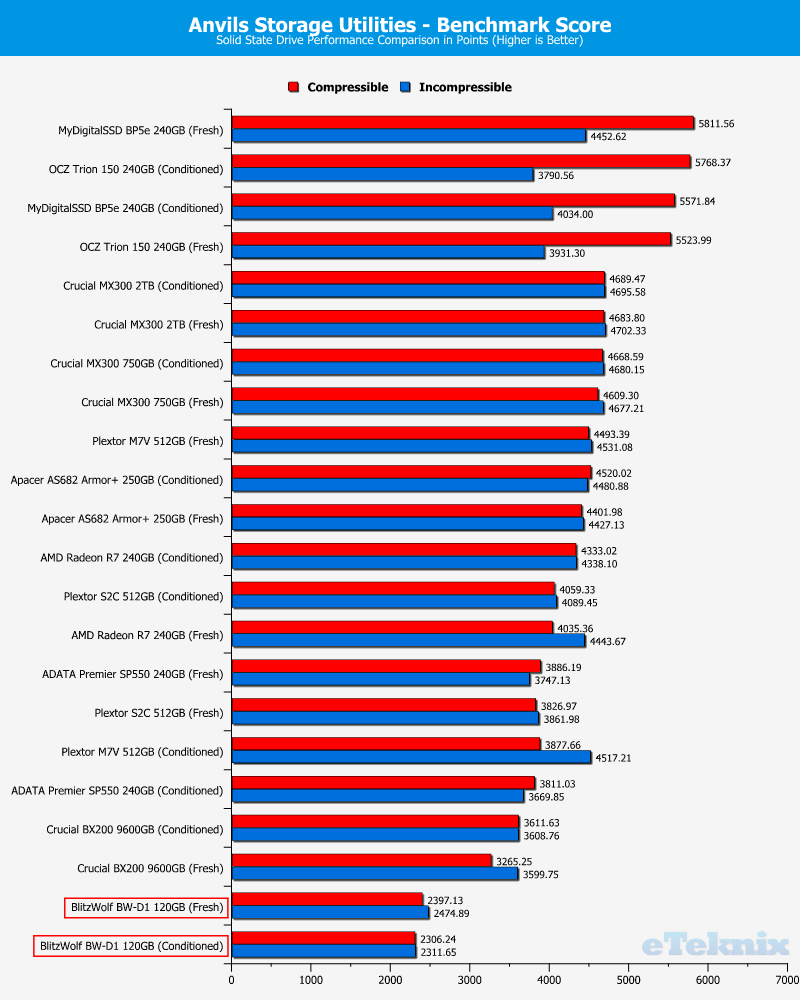
Drive Comparison
For the purpose of drive comparison, I will be using the performance figures from both unconditioned and conditioned tests with 0% data-fill.
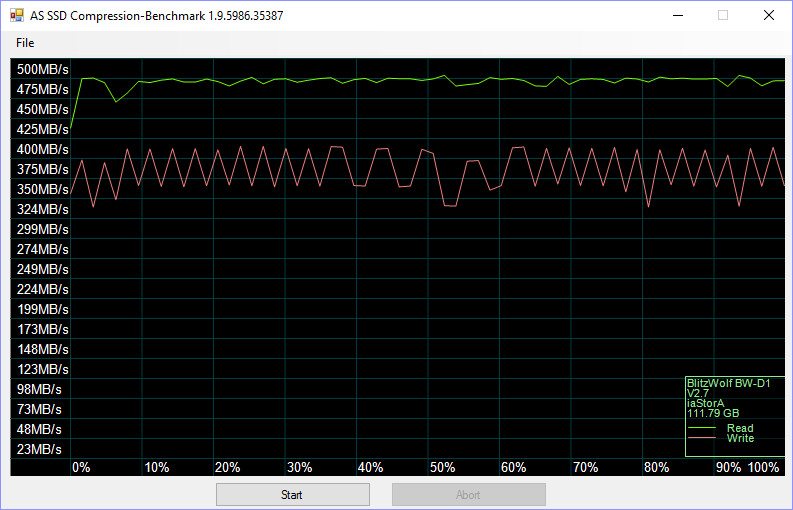
AS SSD
The AS SSD software determines the performance of Solid State Drives (SSD). The tool contains five synthetic and three practice tests. The synthetic tests determine the sequential and random read and write performance of the SSD. These tests are performed without using the operating system caches. In Sequential tests, the program measures the time it takes to read and write a 1 GB file respectively. To give a clearer picture of the drives tested, I’ve chosen to include all tests. Special the copy test is one that I think is relevant on the consumer level as it gives the user a view into one of the operations he’s going to do many times.
Fresh Drive

Conditioned
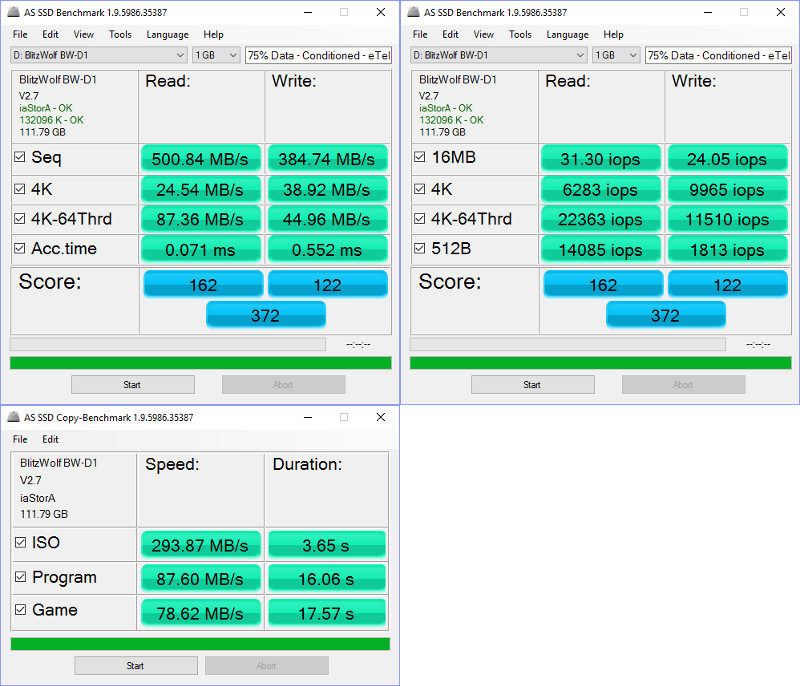
Drive Performance Analysis
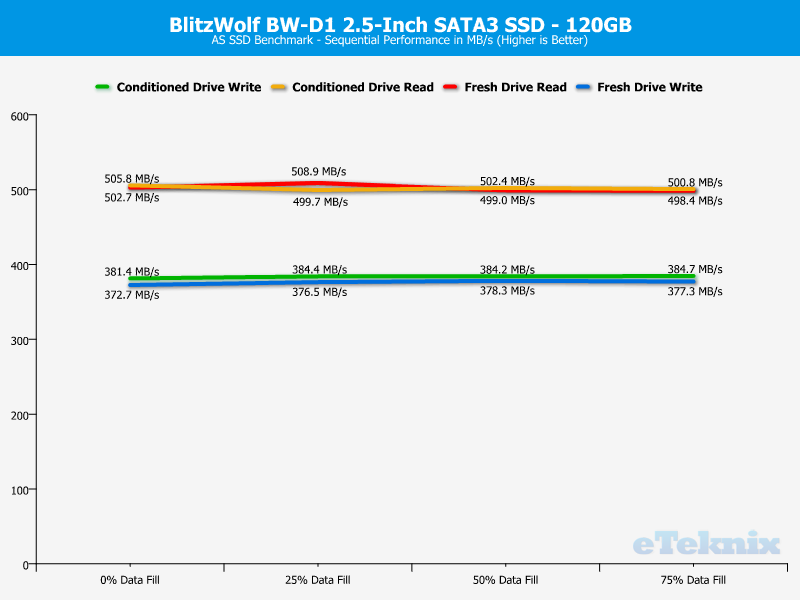
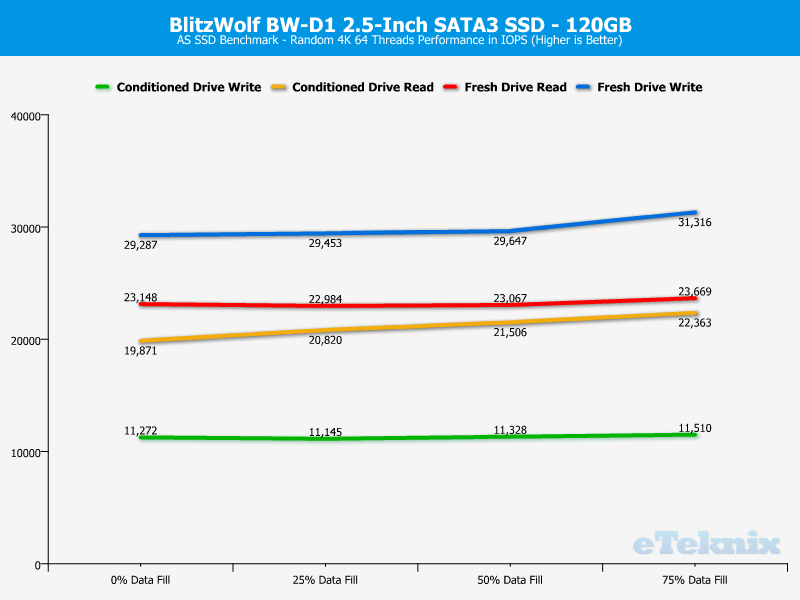
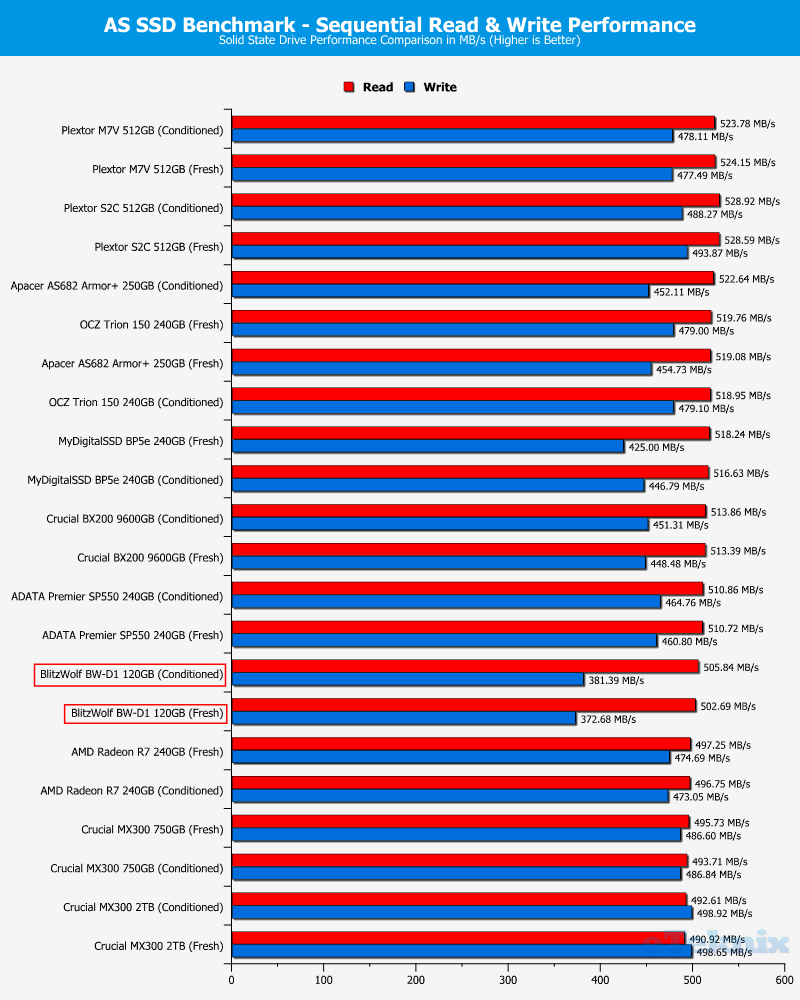
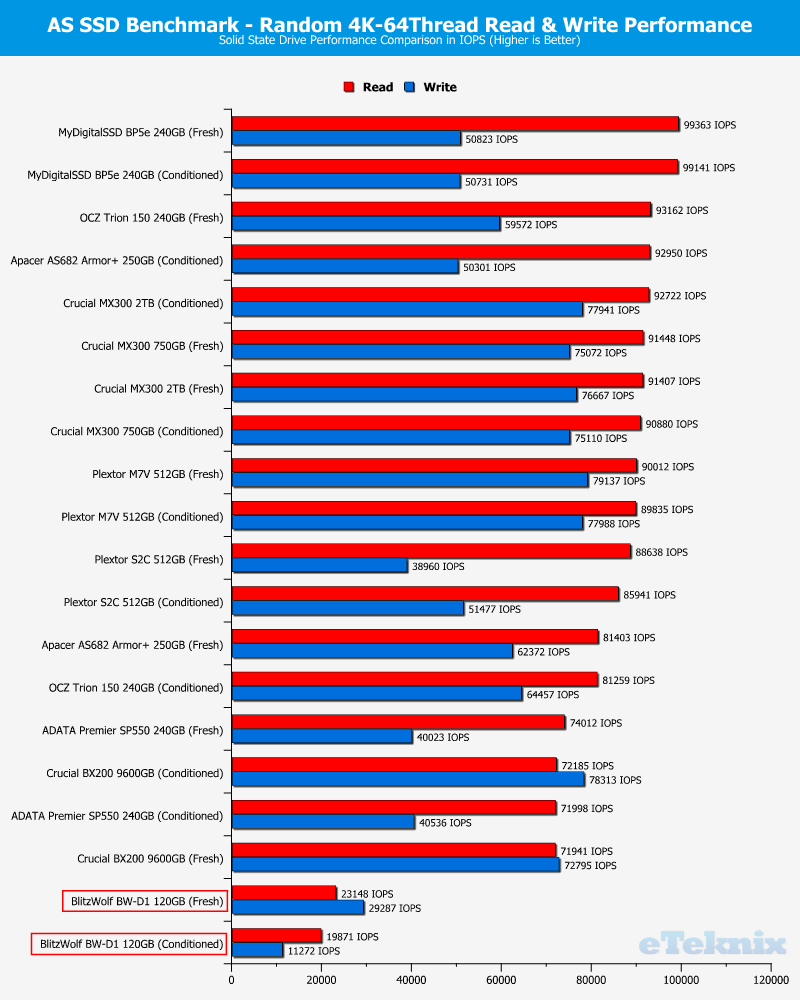
Drive Comparison
For the purpose of drive comparison, I will be using the performance figures from both unconditioned and conditioned tests with 0% data-fill.
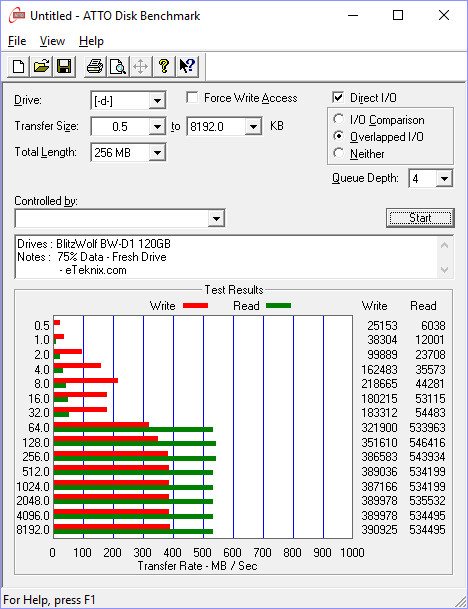
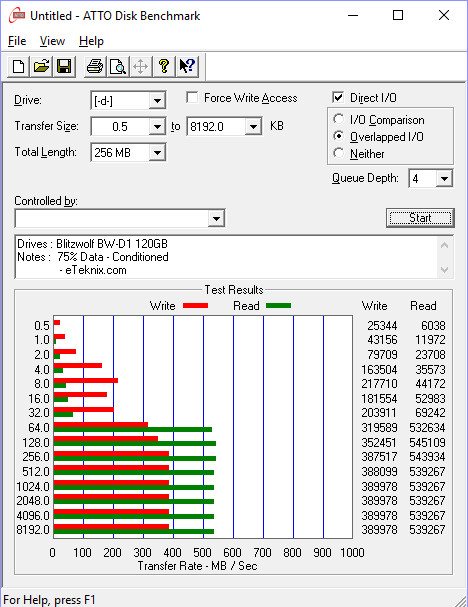
ATTO
The ATTO Disk Benchmark performance measurement tool is compatible with Microsoft Windows. Measure your storage systems performance with various transfer sizes and test lengths for reads and writes. Several options are available to customize your performance measurement including queue depth, overlapped I/O and even a comparison mode with the option to run continuously. Use ATTO Disk Benchmark to test any manufacturers RAID controllers, storage controllers, host adapters, hard drives and SSD drives and notice that ATTO products will consistently provide the highest level of performance to your storage.
Fresh Drive
Conditioned
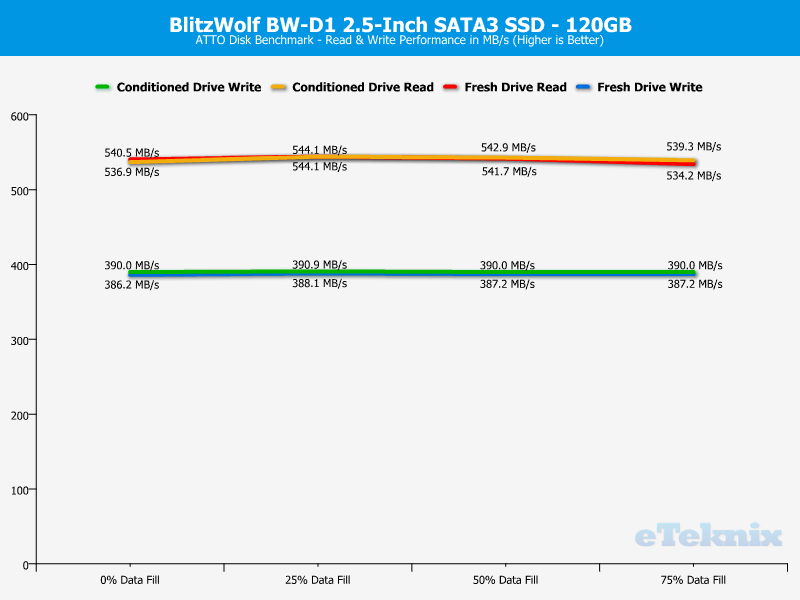
Drive Performance Analysis
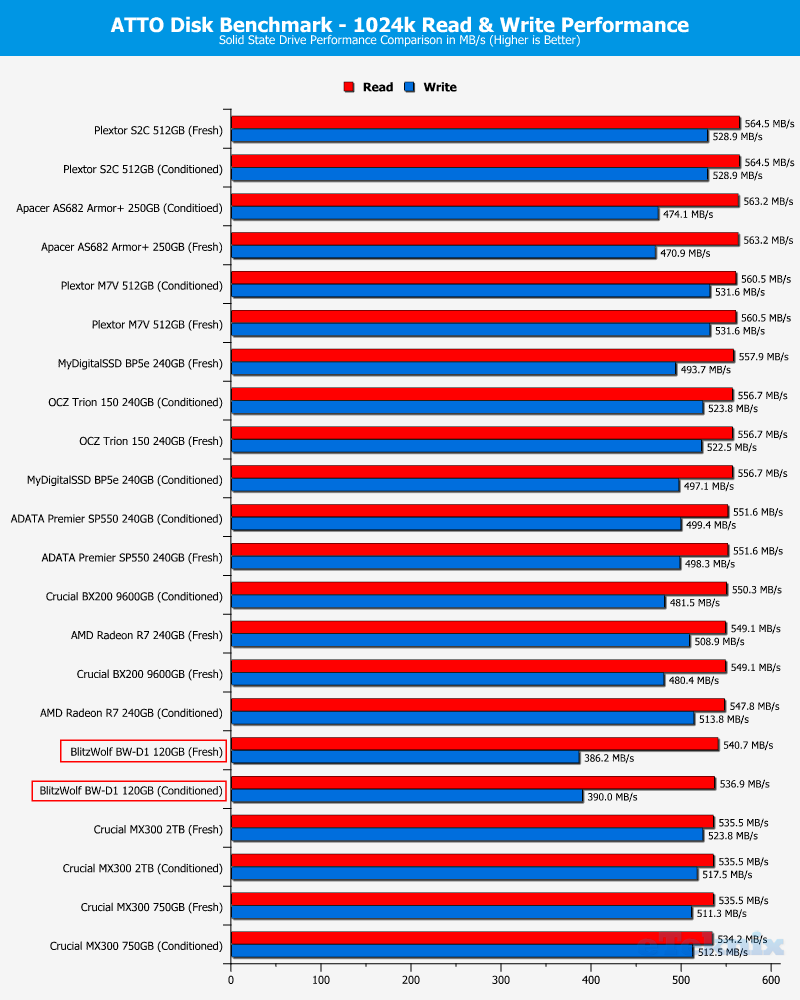
Drive Comparison
For the purpose of drive comparison, I will be using the performance figures from both unconditioned and conditioned tests with 0% data-fill.
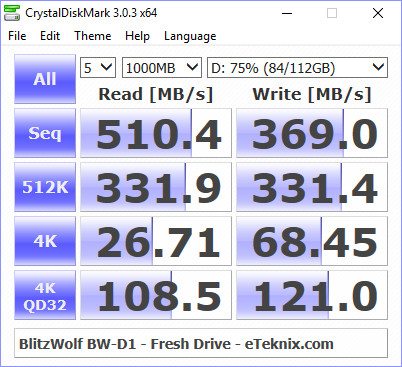
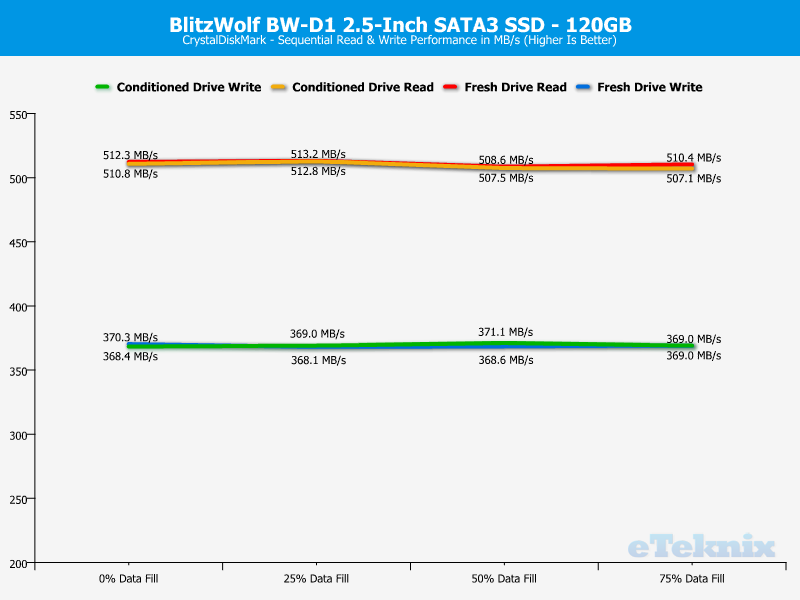
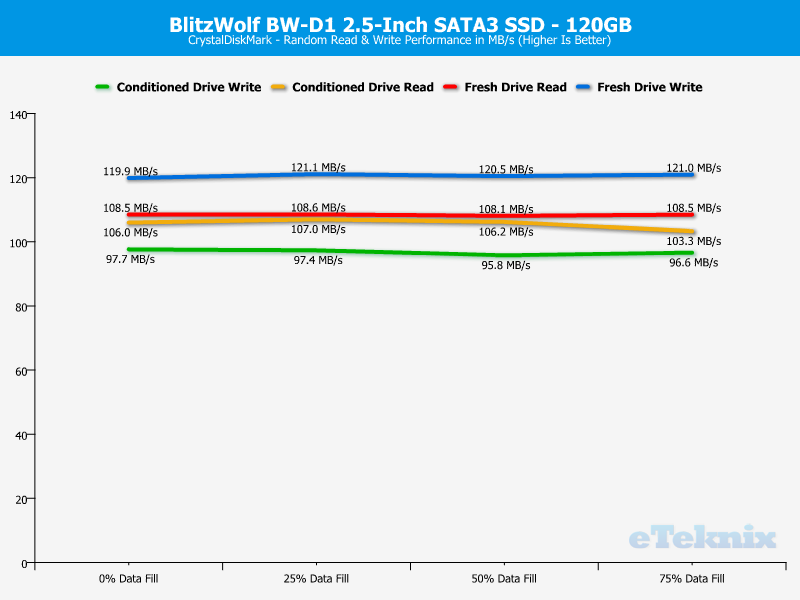
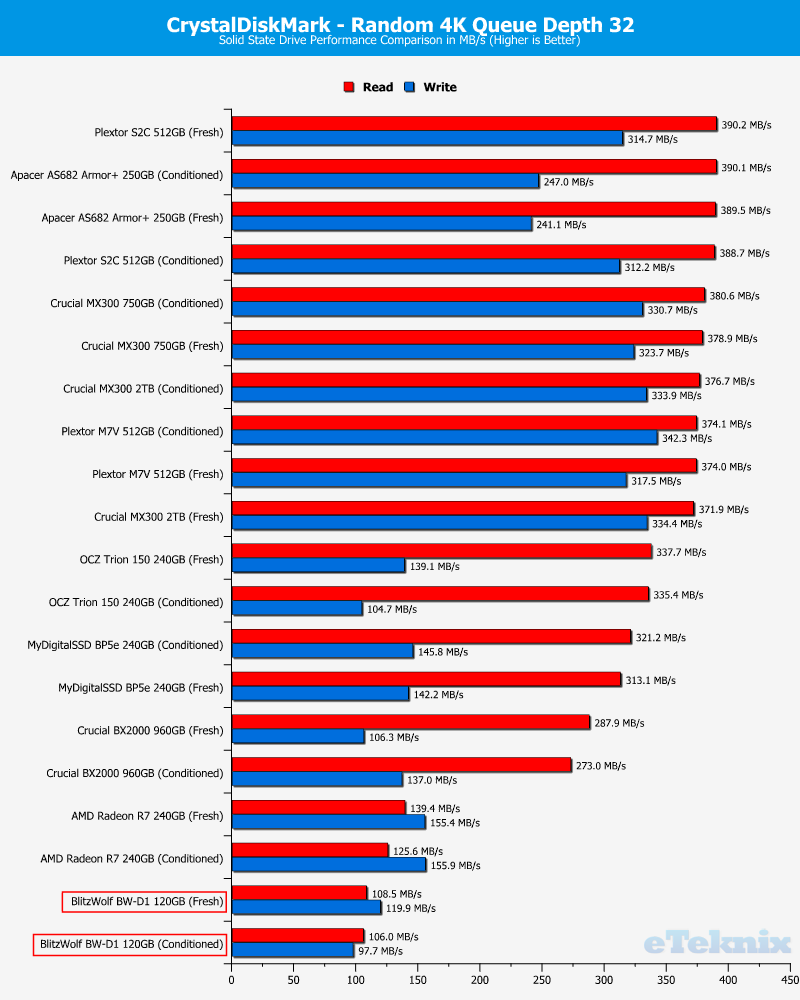
CrystalDiskMark
CrystalDiskMark is a small HDD benchmark utility for your hard drive that enables you to rapidly measure sequential and random 4KB/512KB read/write speeds.
Fresh Drive
Conditioned
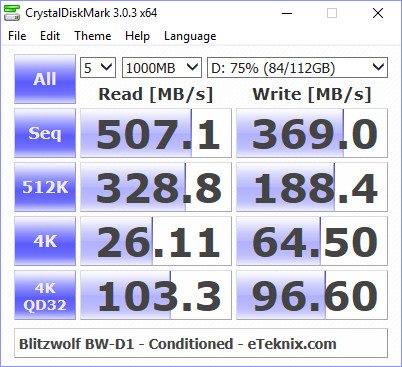
Drive Performance
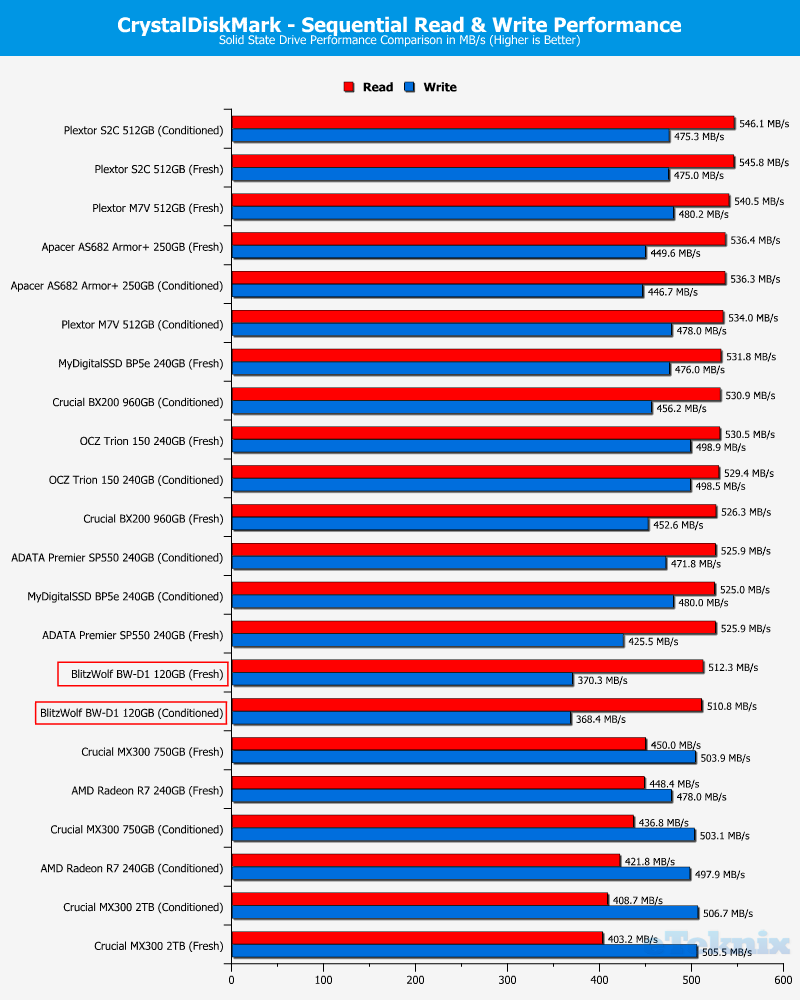
Drive Comparison
For the purpose of drive comparison, I will be using the performance figures from both unconditioned and conditioned tests with 0% data-fill.
IOmeter & PCMark 8
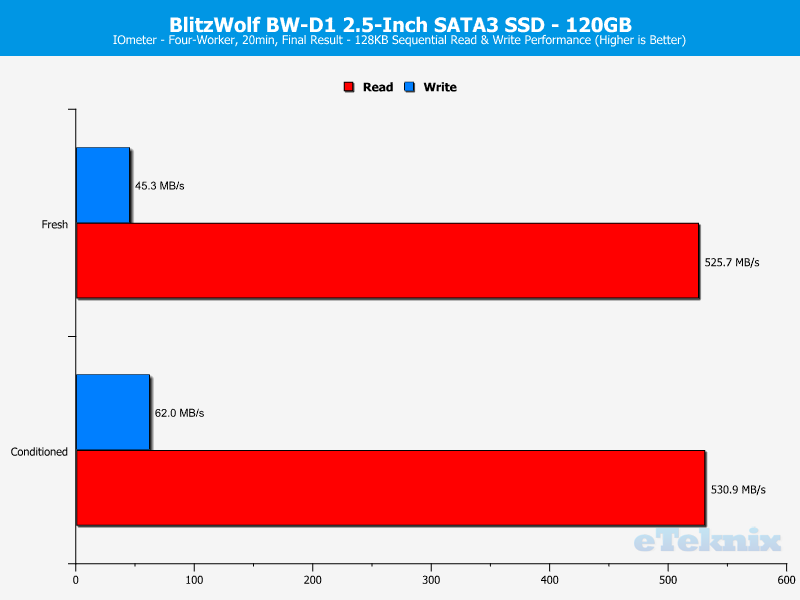
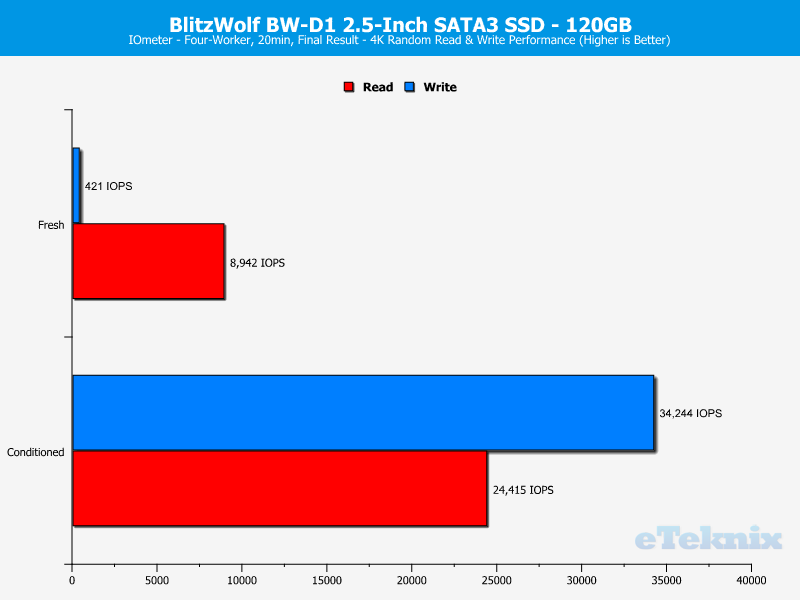
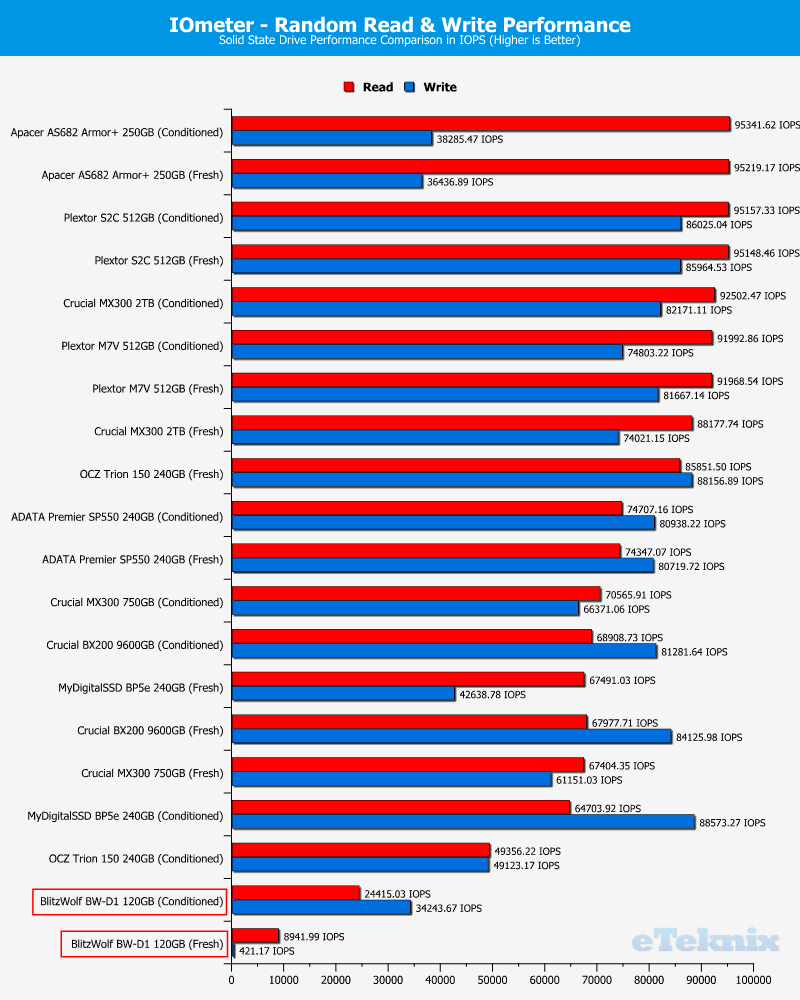
IOmeter
OMeter is an I/O subsystem measurement and characterization tool for single and clustered systems. It is used as a benchmark and troubleshooting tool and is easily configured to replicate the behavior of many popular applications. One commonly quoted measurement provided by the tool is IOPS.
IOMeter allows the configuration of disk parameters such as the ‘Maximum Disk Size’, ‘Starting Disk Sector’ and ‘# of Outstanding I/Os’. This allows a user to configure a test file upon which the ‘Access Specifications’ configure the I/O types to the file. Configurable items within the Access Specifications are Transfer Request Size, Percent Random/Sequential distribution, Percent Read/Write Distribution, Aligned I/O’s, Reply Size, and TCP/IP status among others.
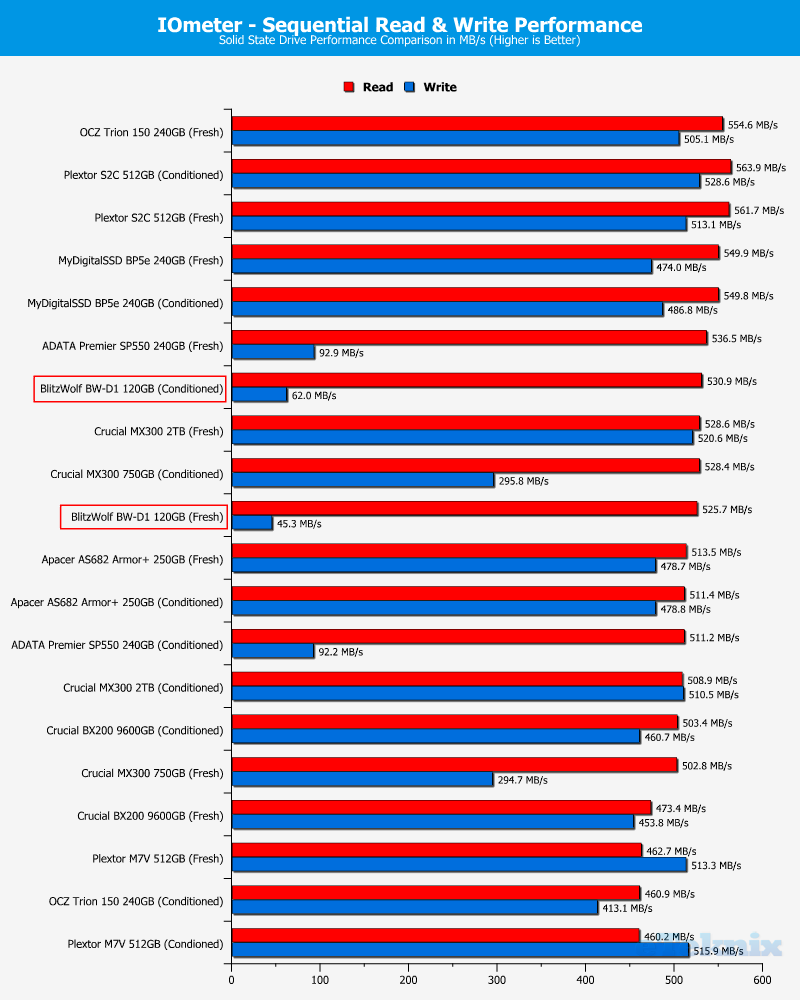
Sequential Performance
Random 4K Performance
Drive Comparison
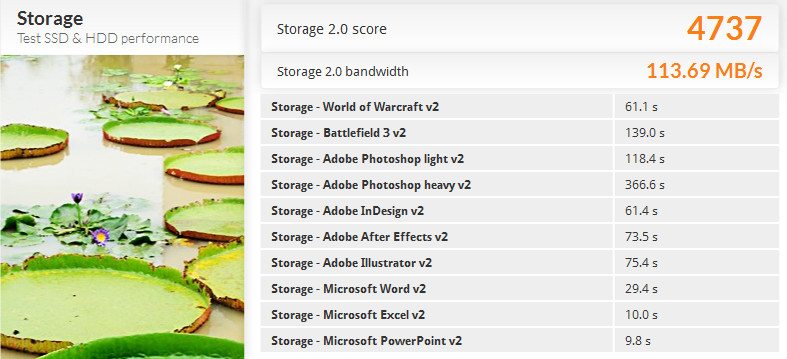
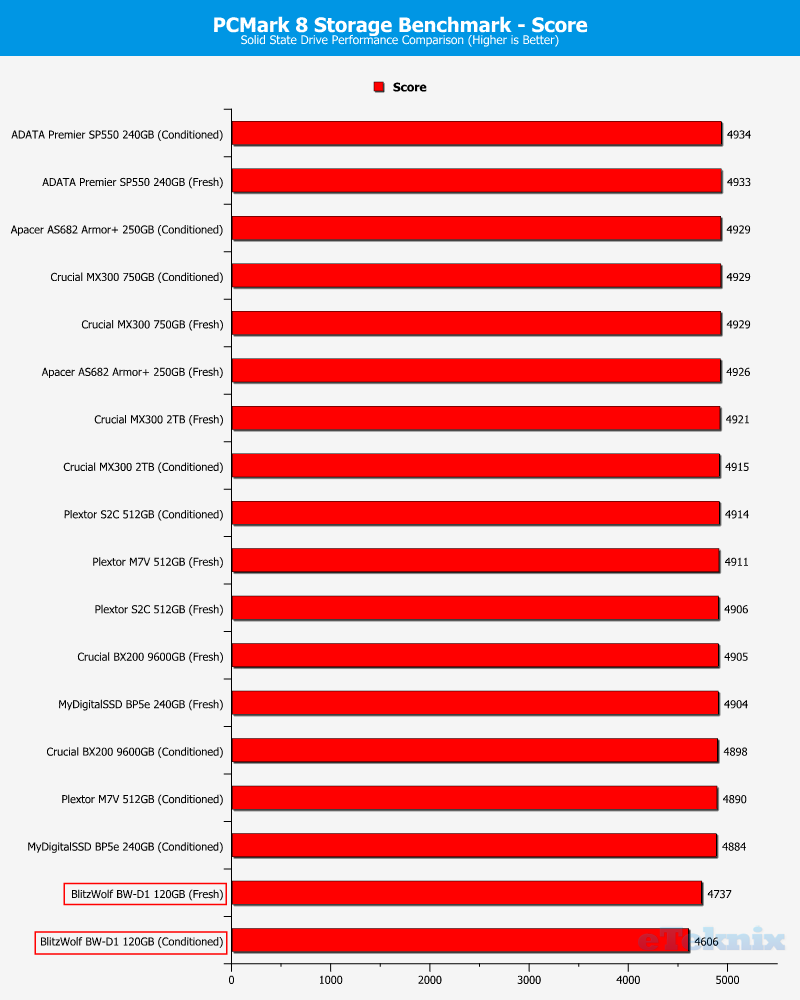
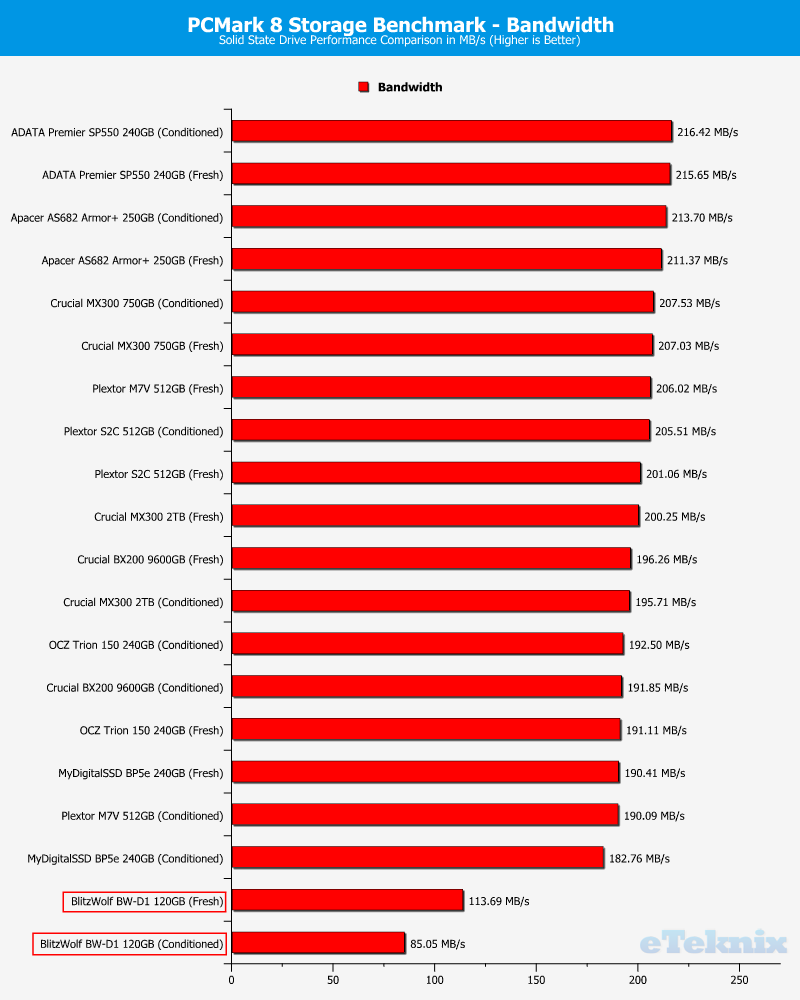
PCMark 8
PCMark 8 Storage benchmark is used test the performance of SSDs, HDDs, and hybrid drives with traces recorded from Adobe Creative Suite, Microsoft Office and a selection of popular games. You can test any recognized storage device, including local external drives. Unlike synthetic storage tests, the PCMark 8 Storage benchmark highlights real-world performance differences between storage devices.
Fresh Drive
Conditioned Drive

Drive Comparison
Final Thoughts
Pricing
At the time of writing, the BlitzWolf BW-D1 can be found at Banggood for £44.21 and $54.99 USD which equals to $0.46 and £0.37 per GB of storage. You can get another $15 off the price with the coupon “10bwssd” at the time of writing.
Overview
This was the first solid state drive from BlitzWolf that I had the pleasure to review and the while the BW-D1 might be on the lower end of the performance scale, it does have situations where it could be useful.
Let us start out with the good sides. The BlitzWolf BW-D1 comes with all the SSD features you’ll want, including Device Sleep for ultra-low power consumption in sleep and hibernation modes. It looks good with its simple black and white design, and it will fit most systems thanks to the default 2.5-inch form factor and SATA3 interface. The BW-D1 also delivers some great read figures.
The downside to this drive is the write performance and that’s sub-par. The performance drops to near USB 2.0 levels on continuous drive writes which is a good deal below HDD speeds. Random read and writes as well as access times aren’t the best either. And there is a simple reason for this, or rather two reasons. The drive doesn’t feature and DRAM cache and it is only a 120GB capacity drive.
While the drive isn’t great at writing, there are several usage scenarios where this drive would do a good job. HTPCs and DIY headless units that barely do more than boot of the OS drive will be obvious locations. The drive is silent and consumes little power which are preferable traits in drives used in such systems. However, I wouldn’t recommend it for anything else due to the low write scores.
Pros
- Good read speeds
- Good SSD feature set
- Simplistic Black and White design
- Worldwide shipping
Cons
- Low write performance
- Low IOPS scores
“While the BlitzWolf BW-D1 120GB SSD doesn’t convince with its write scores, it does a great job when reading.”
Thank you BlitzWolf for providing us with this sample.