Silicon Power S56 240GB Solid State Drive Review
Bohs Hansen / 7 years ago
Introduction
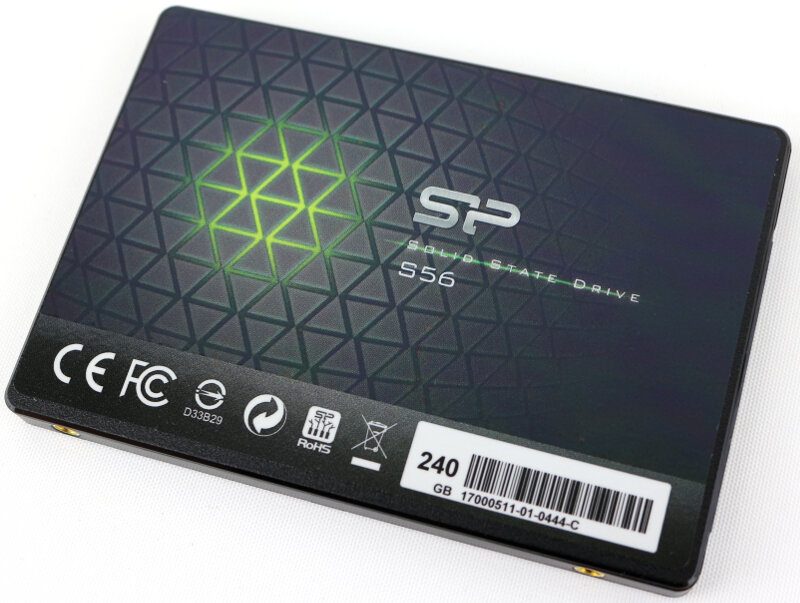
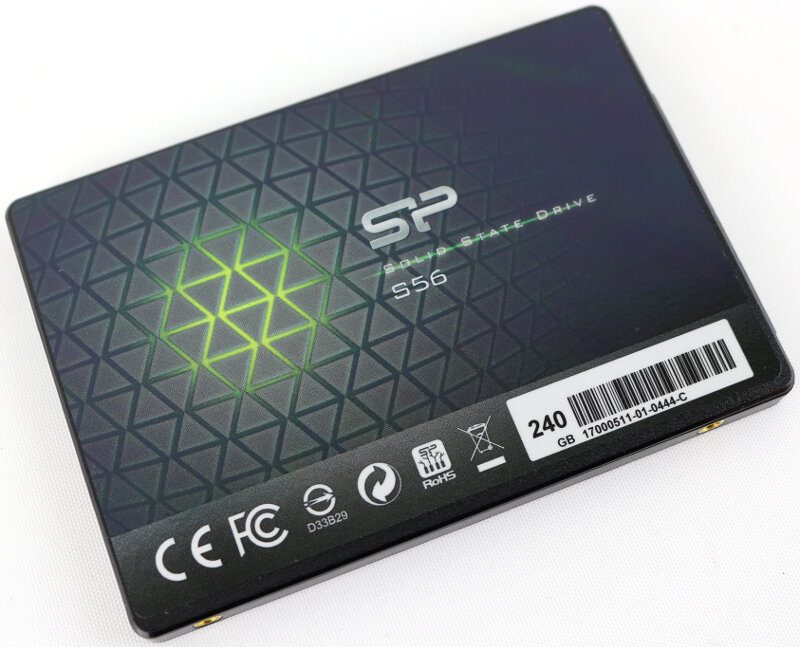
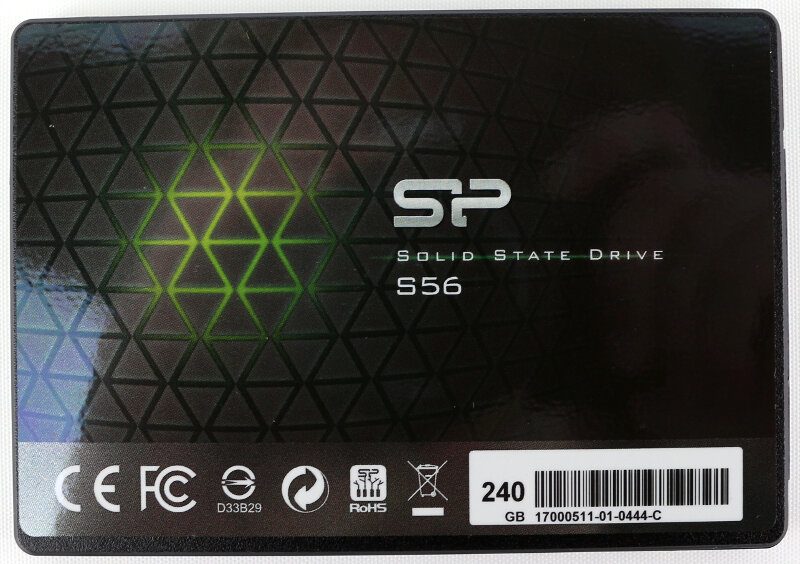
The Silicon Power S56 is a whole new drive series that comes with a fresh design on the outside and great hardware on the inside. The S56 is categorised as an entry grade solid state drive and is as such meant as HDD replacement.
Replacing your old mechanical hard disk drive with a new and modern solid state drive can boost a lot of life into old systems that still rely on the old technology. As long as they have an SATA port available, an SSD will greatly benefit your performance, and it is the cheapest upgrade you can do. You’ll get increased boot-up times as well as, faster program loading, and quicker access times.
Silicon Power rates the S56 for a sequential performance up to 560MB/s when reading and up to 530MB/s when writing. This performance is thanks to the combination of SLC cache with TLC NAND memory. The cache will give great burst speeds while the TLC NAND keeps the costs down. The Internal Auto-copy technology also helps boost the performance. It allows automatic copy operation from SLC cache to TLC blocks inside the NAND without using the controller or DDR.
While SSDs last for a long time, every drive will start to generate bad blocks at some point. We don’t want that as we don’t want to lose our precious data. The S56 employs Bad Block Management too, which continuously monitors and replaces bad blocks to keep your system in good condition and prolong the lifespan of the drive.
Naturally, it also features the standards such as the S.M.A.R.T. monitoring system as well as Error Correction Code (ECC) technology thanks to the Phison controller.
Silicon Power offers the drive in capacities from 120GB and all the way up to 960GB. That kind of capacity also makes it a good secondary drive for your game library. The mean time before failure (MTBF) rating is 1.5 million hours, and the drive features a 3-year warranty.
You can also add extra value to your Silicon Power S56 drive by downloading the SP Toolbox. This handy little SSD toolbox app can help you monitor and maintain your Silicon Power SSD with its features.
Usually, I would open up the drive and have a look at the internals. In this case, it doesn’t seem to be possible without destroying the drive. I couldn’t find any screw holes, and it appears that it’s glued together. While this sucks a bit for this review, it could be beneficial. It does remove the last moveable parts from the drive, and as such, it could make it more vibration proof.
Feature Highlights
- Adopt TLC NAND flash and the “SLC Cache Technology” to improve overall performance
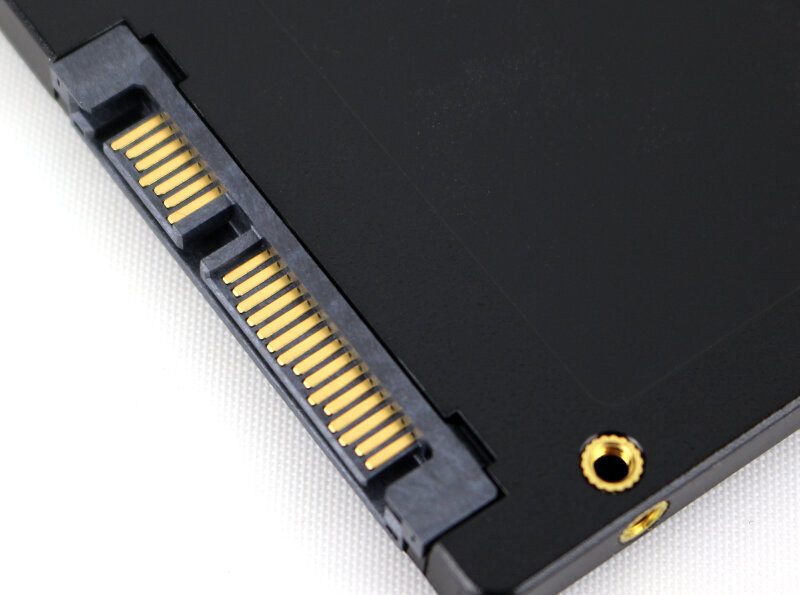
15 x faster than a standard 5400 HDD - 7mm slim design suitable for Ultrabooks and Ultra-slim notebooks
- Supports TRIM command and garbage collection technology
- NCQ and RAID ready
- Equipped with ECC technology to guarantee reliable data transmission
- Built-in S.M.A.R.T. monitoring system
- Low power consumption, shock and vibration-proof, noiseless and low latency
- Free SP ToolBox software download which provides multiple ways to obtain disk information such as self-monitoring analysis report, extent of consumption and SSD diagnostics
Package and Content
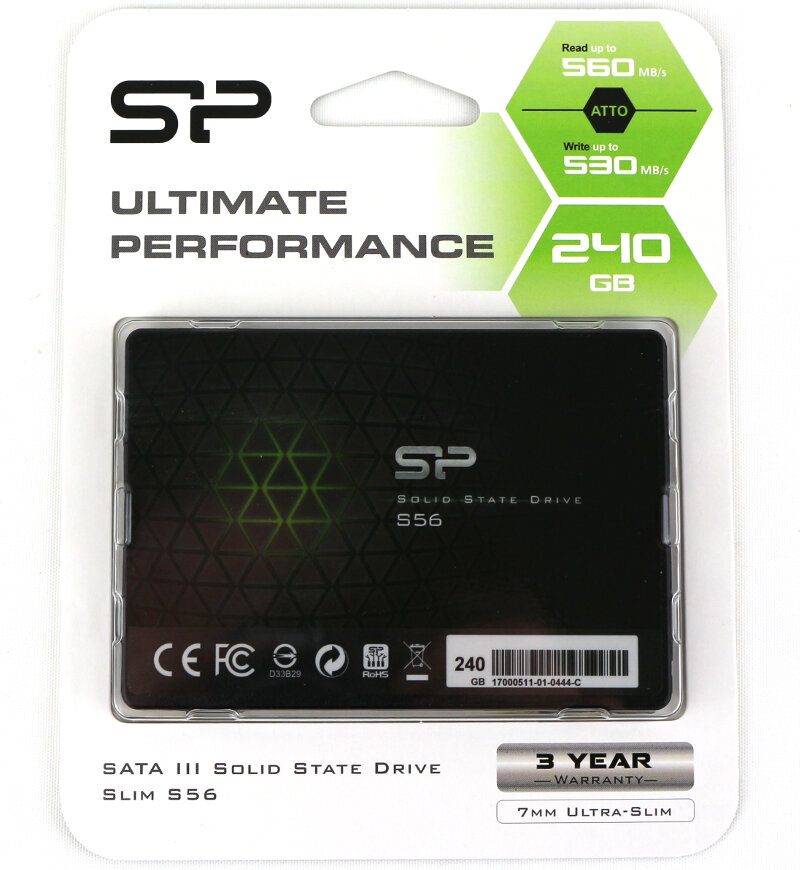
The SP56 comes in a simple package, but also one that is more than sufficient. The included drive is shown off through the plastic part while the cardboard presents you with all the vital information.
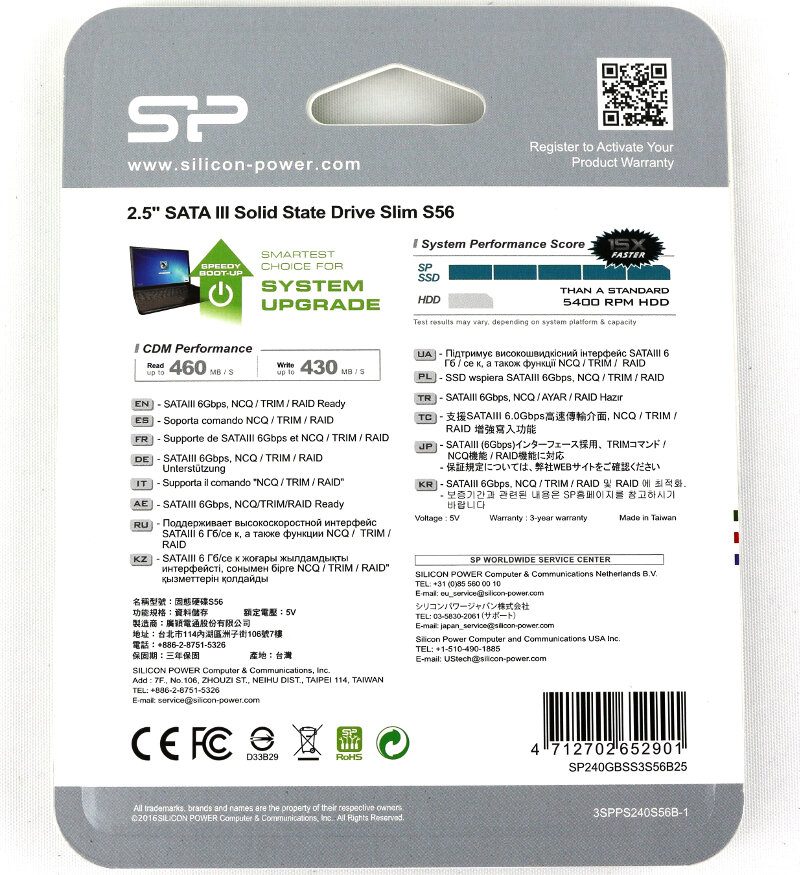
The rear side has a few more detail on the features and the performance.
Testing & Methodology
Hardware
- Gigabyte Z79X UD5H-BK
- Intel Core i7-4790K
- G.Skill Ares DDR3 1866MHz (2x4GB)
- OCZ Vertex4 256GB
- CoolerMaster Silent Pro Hybrid 850W
- NZXT Kraken X60
- Dimastech Easy V3
Software
- AIDA64 Storage Benchmark
- Anvil’s Storage Utilities
- AS SSD Benchmark
- ATTO Benchmark
- CrystalDiskMark
- IOMeter
- PCMark 8 Storage Benchmark
- Windows 10
In a bid to make our testing as thorough and as accurate as possible, we have devised a testing methodology that will give us the maximum amount of data. While this means that testing each drive will take considerably longer – easily up 36 hours – the overall picture that we can gather is bigger too. It helps both you as the reader and us as the reviewer’s to gain a clearer view of the drive’s overall performance, strengths, and weaknesses. It also provides a more accurate analysis on how each drive performs under different conditions.
There are many ways to test a storage drive, and we have chosen to include close to every test possible. We will start with a common benchmark analysis of the formatted drive with various fillage scenarios. Depending on how a drive is built, it might perform differently depending on how much data it already is storing. To test this, the drive will be tested empty as well as with 25%, 50%, and 75% space usage. For these tests, we will be using Anvil’s Storage Utilities, AS SSD Benchmark, ATTO Benchmark, and CrystalDiskMark. Besides these synthetic fill tests, the drive will also be tested with PCMark 8’s storage benchmark to get real-world performance results.
Following the fillage tests, the partition will be removed, and we test the drive’s raw performance. These tests will determine the hardware’s capabilities while removing any interference from the set file system. AIDA64’s storage benchmark and IOmeter are both great tools for this, and they help us paint an even clearer picture of the drive. The IOmeter tests I run are quite different from the rest as they will give a final result after a longer performance test rather than a maximum or average score. This gives us yet another view of the tested drive over the regular tests.
Durability is a vital factor when it comes to NAND-based drives as the chips only can be rewritten so many times before they’ll stop working properly. Modern SSDs come with wear-level algorithms to increase the lifetime and reduce this factor as much as possible. We also take this into consideration in our reviews even tho it would take years to simulate this under real-world conditions. Luckily, Anvil’s Storage Utilities comes with an endurance test that can perform this action much faster, but it is still a time-consuming process. process. Depending on the hardware, this can easily take several days, and we write thousands and thousands of small files in various sizes and compressibility to drive over and over.
Following this conditioning process, all of the previous benchmarks will be run again in the same scenarios and the same order. This will give us a great view on how a drive will perform after prolonged usage, and that is a very vital factor when you pick out your storage drive.
Modern operating systems all take care of the TRIM command in the background and it isn’t something to worry about for regular users. However, for these reviews, I will add a waiting period between each benchmark to make sure that the TRIM command has been fully executed and finished. After all, we want a clear picture of the drive’s performance with minimal interference from the operating system.
On each page that follows with the benchmark results, I have inserted result screenshots from the benchmarks, created drive analysis chart for the fill-level performance, and added drive comparison charts where possible.
AIDA64
AIDA64 is a streamlined Windows diagnostic and benchmarking software for home users. It provides a wide range of features to assist in overclocking, hardware error diagnosis, stress testing, and sensor monitoring.
It has unique capabilities to assess the performance of the processor, system memory, and disk drives and is compatible with most Microsoft Windows operating systems. It also has a disk benchmark tool, and that is the one I’ll be using.
Fresh Drive
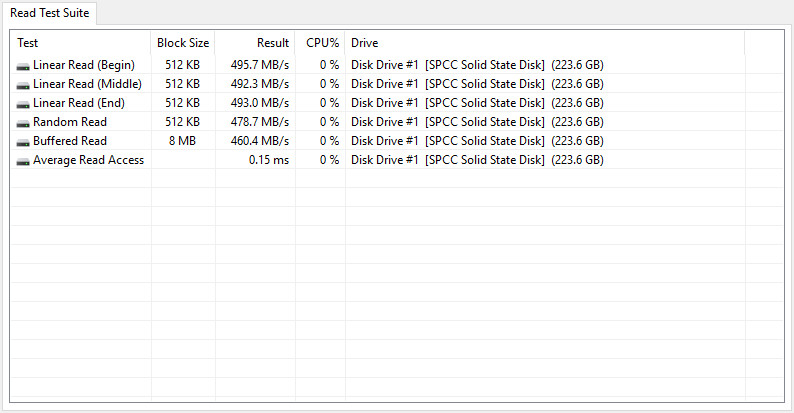
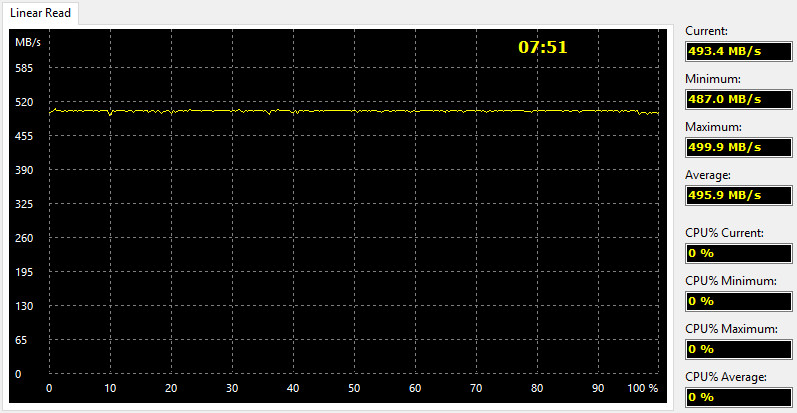
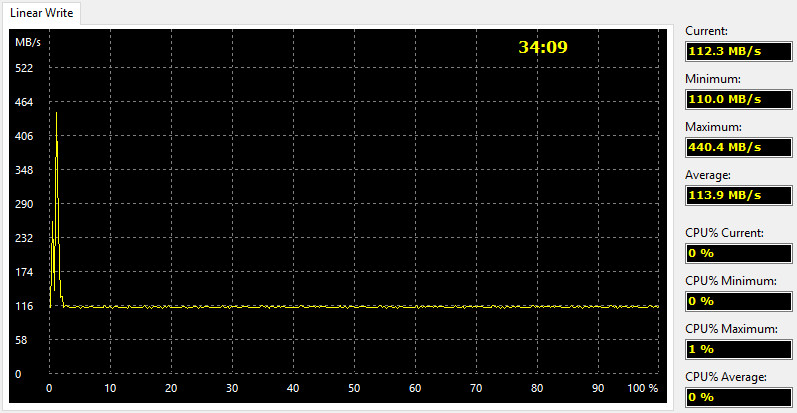
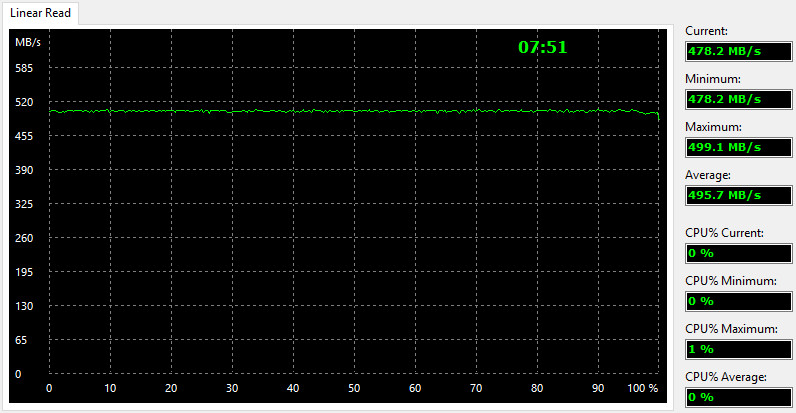
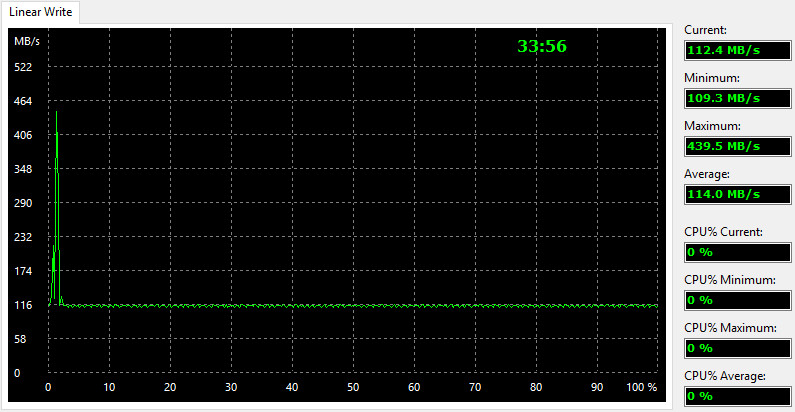
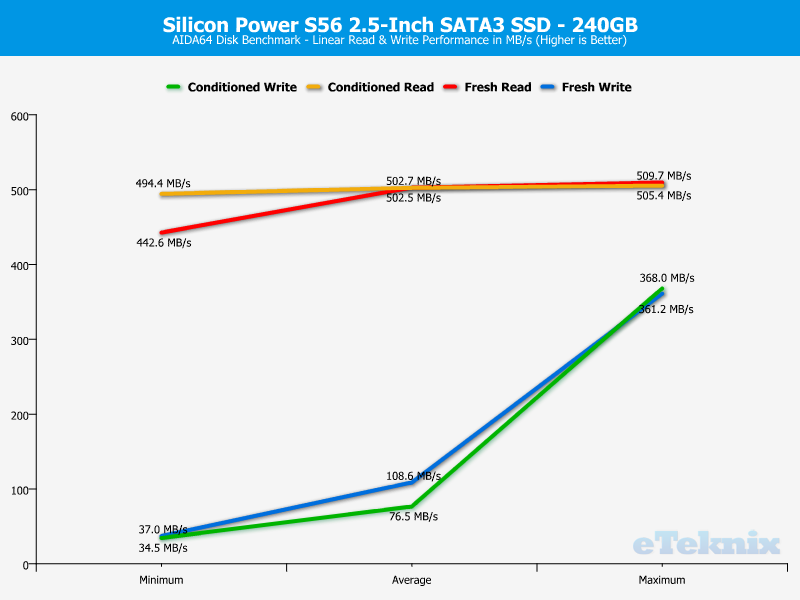
The Linear Read and Write tests measure the sequential performance by reading or writing all sectors without skipping any. It gives, as the name says, a linear view of the drives overall performance from start to end.
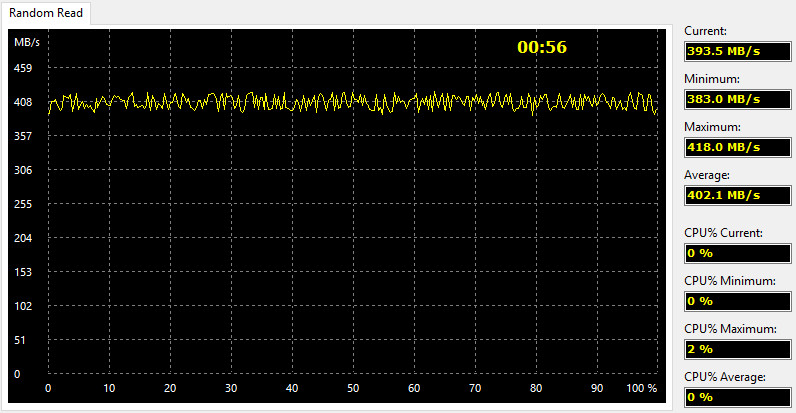
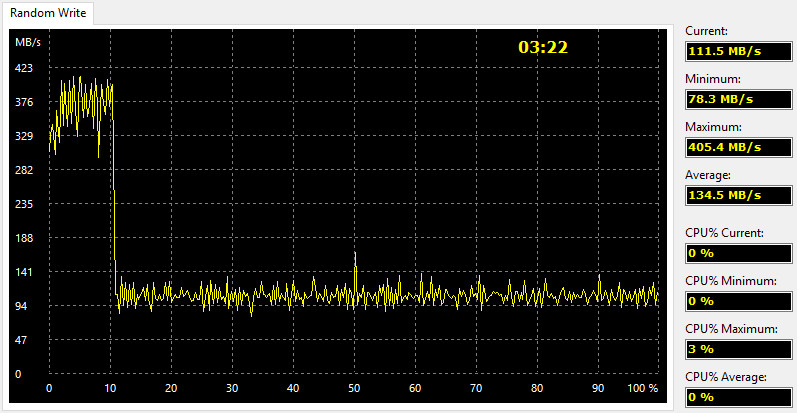
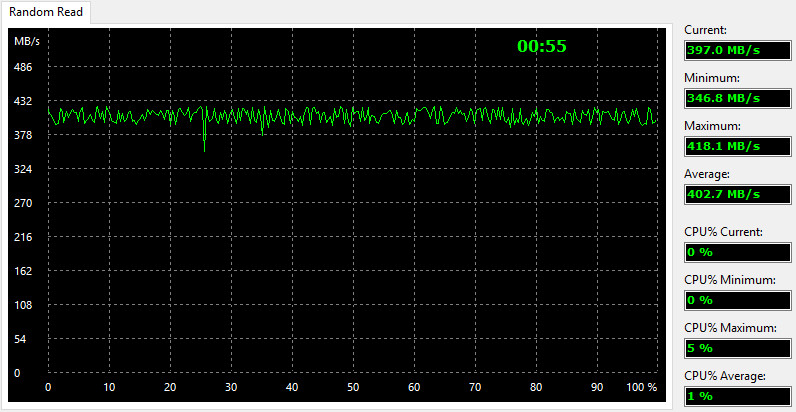
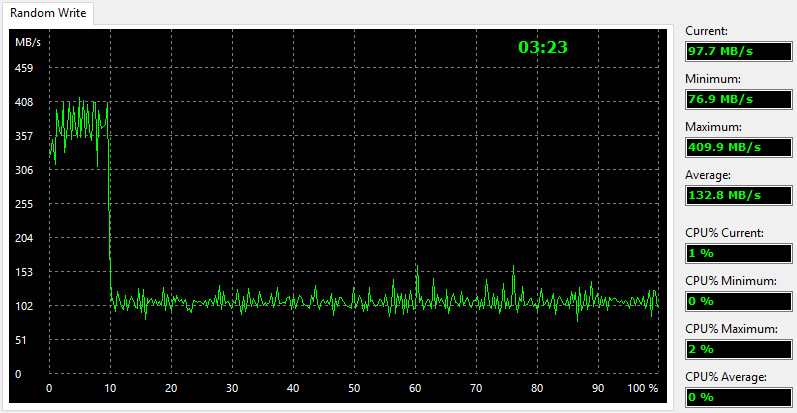
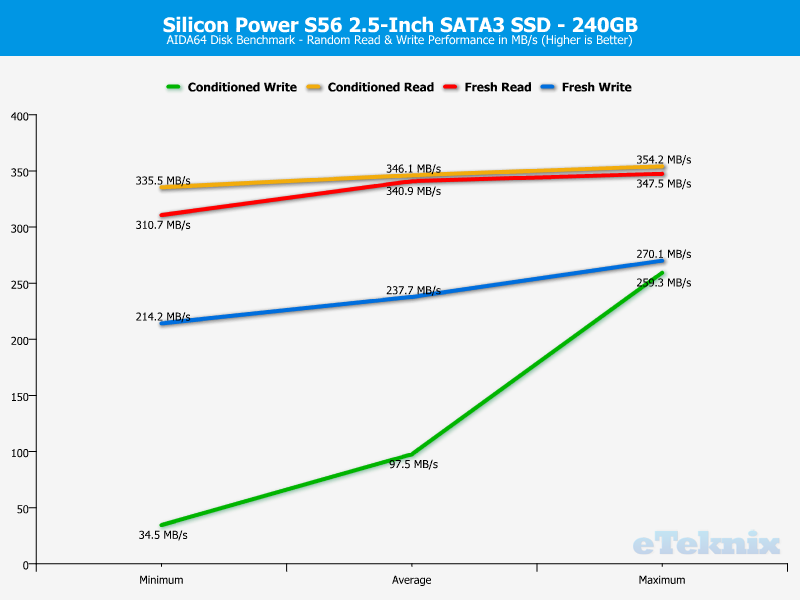
The Random Read and Write tests measure the random performance by reading or writing variable-sized data blocks at random locations on the surface of the drive. The Random tests are a combination of both speed and access times as it moves the position before each new operation.
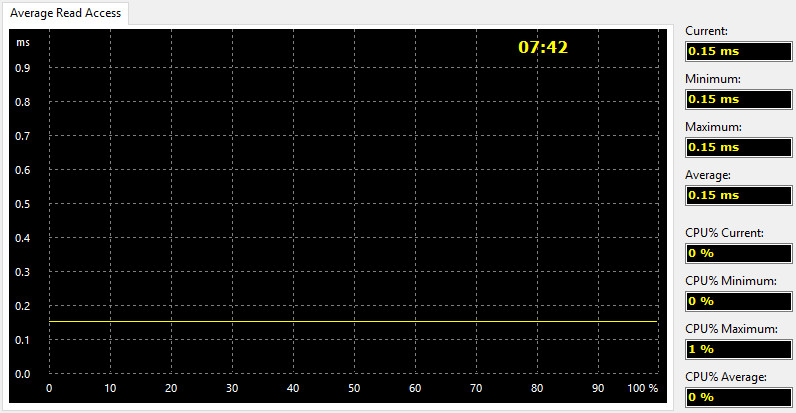
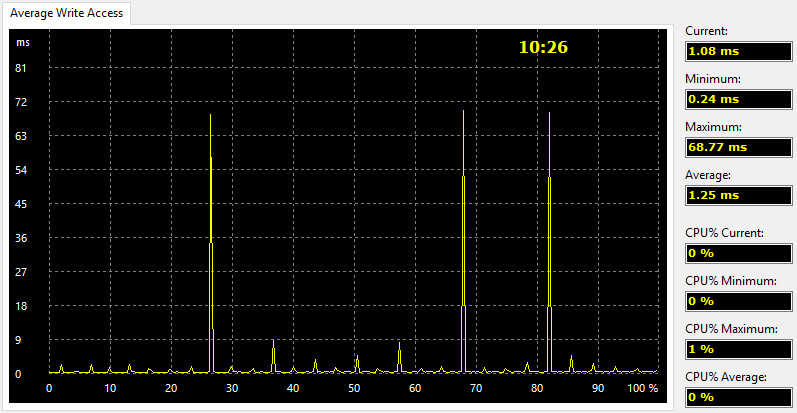
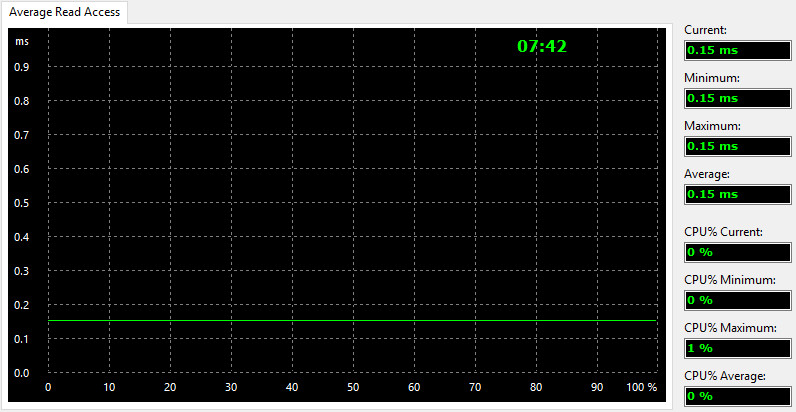
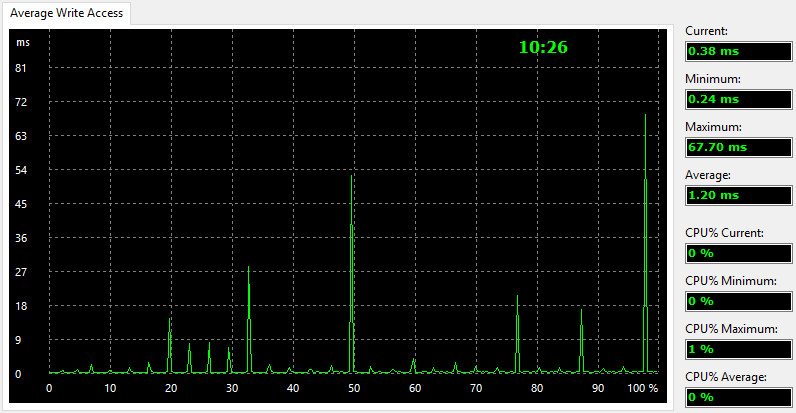
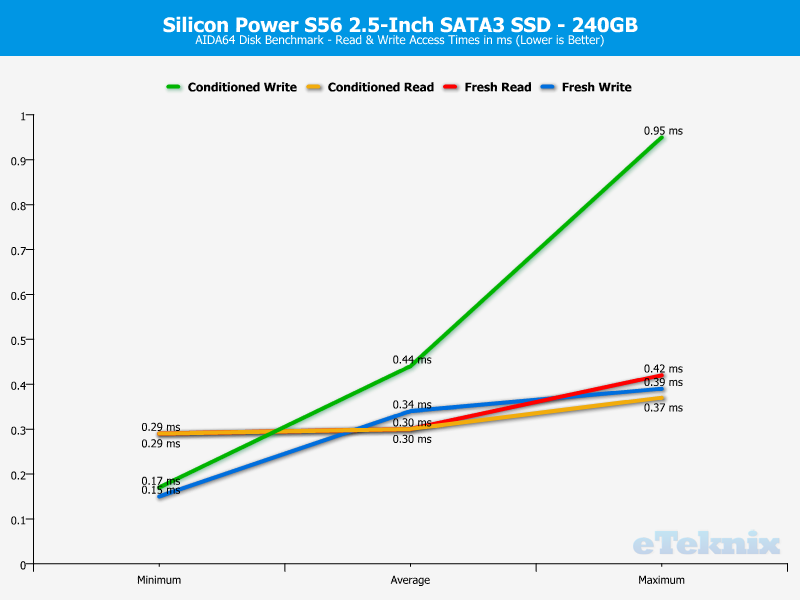
The Access time tests are designed to measure the data access performance by reading or writing small 0.5KB data blocks at random locations on the drive surface.
Conditioned Drive
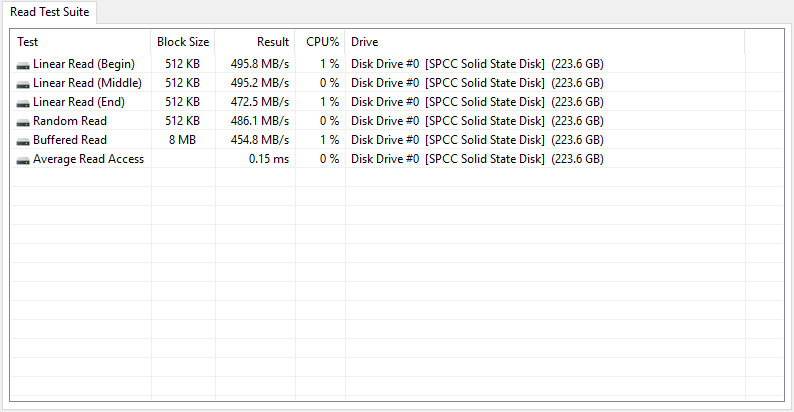
The Linear Read and Write tests measure the sequential performance by reading or writing all sectors without skipping any. It gives, as the name says, a linear view of the drives overall performance from start to end.
The Random Read and Write tests measure the random performance by reading or writing variable-sized data blocks at random locations on the surface of the drive. The Random tests are a combination of both speed and access times as it moves the position before each new operation.
The Access time tests are designed to measure the data access performance by reading or writing small 0.5KB data blocks at random locations on the drive surface.
Performance Analysis
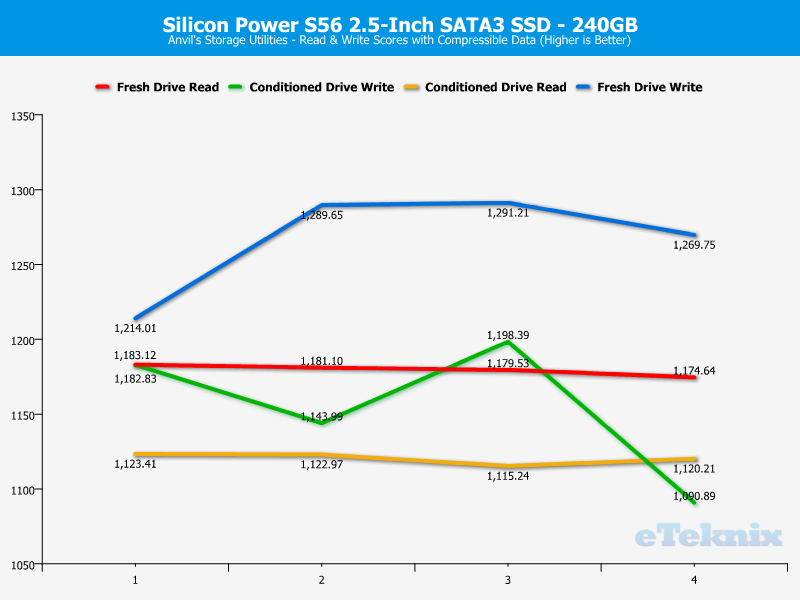
Anvil’s Storage Utilities
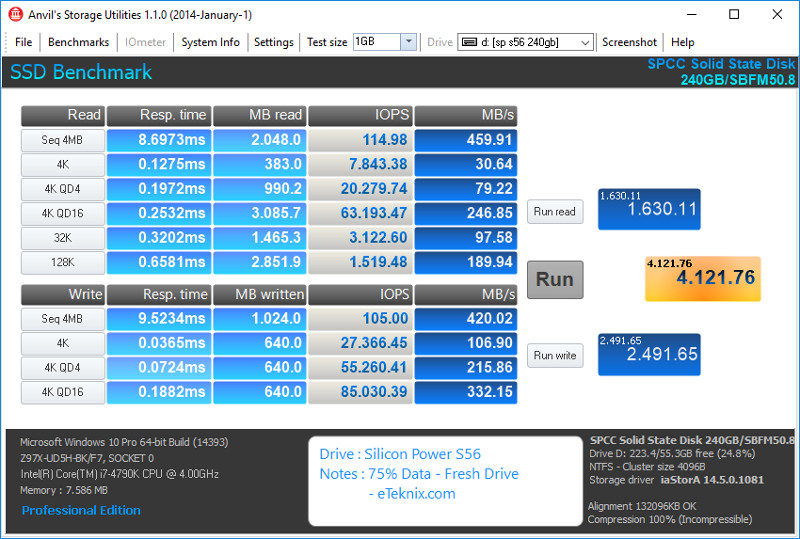
Anvil’s Storage Utilities is a complete benchmark used to test any writeable storage drive. It also has a drive endurance test that consistently reads and writes data to the selected medium to give days, months, and potentially even years of use in a shorter period of time. This is great to see how a drive copes in the longer term.
Fresh Drive

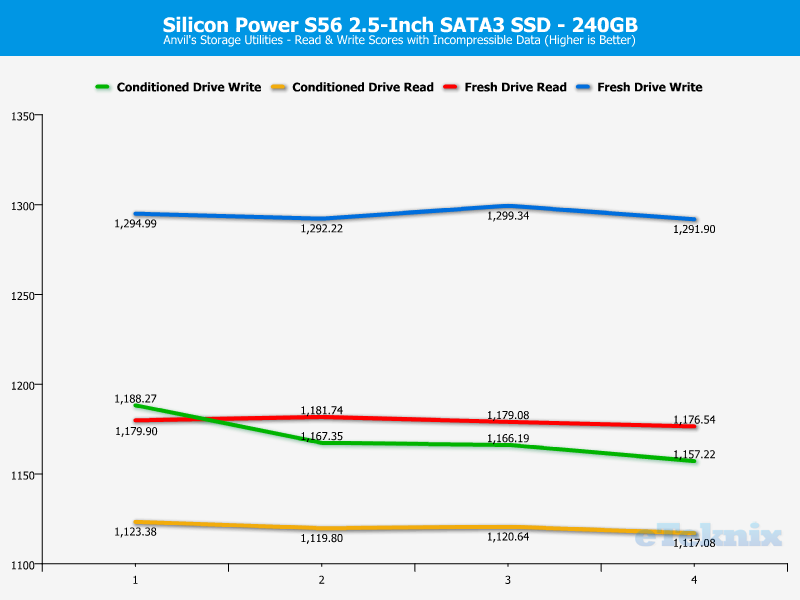
Conditioned Drive


Drive Performance Analysis
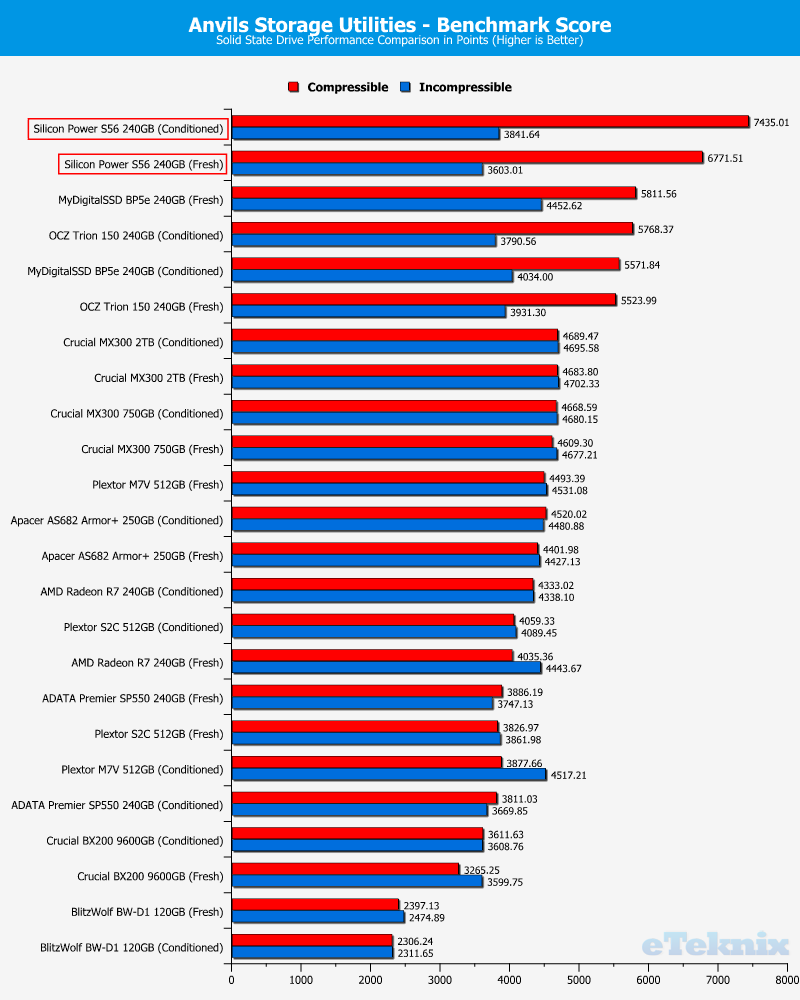
Drive Comparison
For the purpose of drive comparison, I will be using the performance figures from both unconditioned and conditioned tests with 0% data-fill.
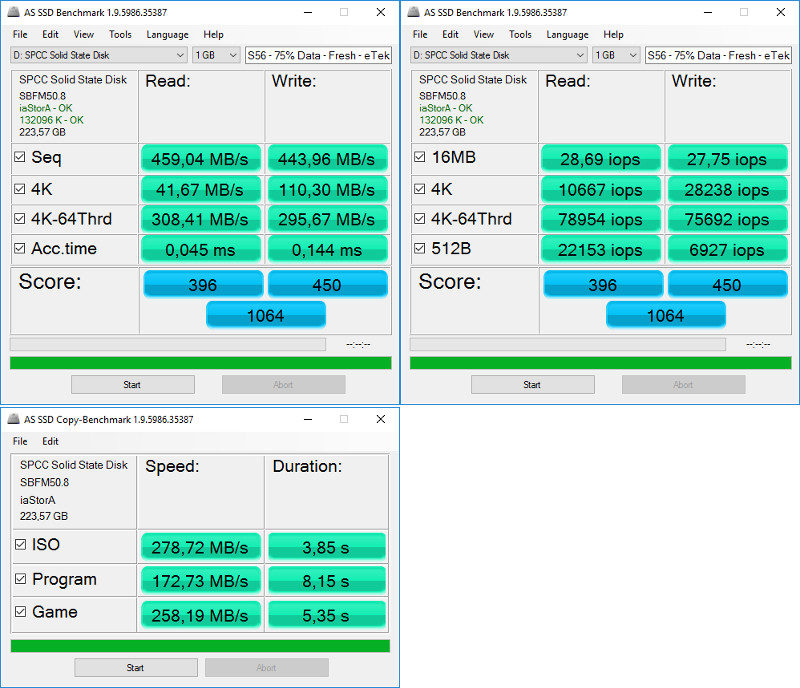
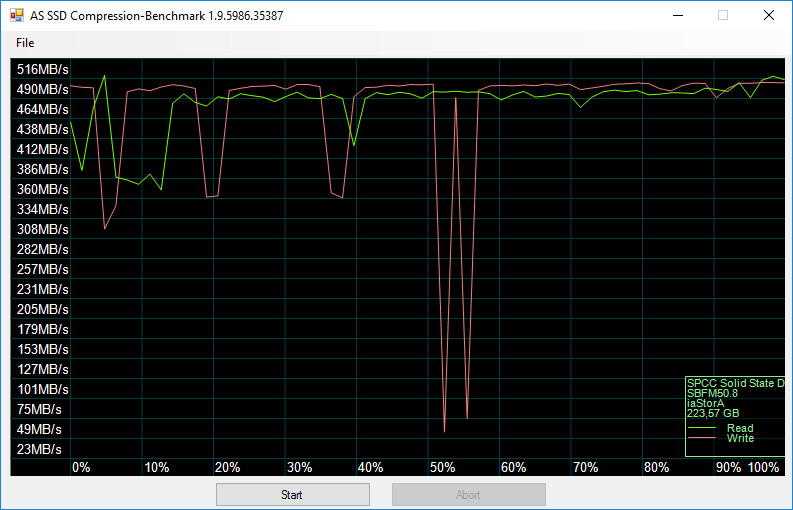
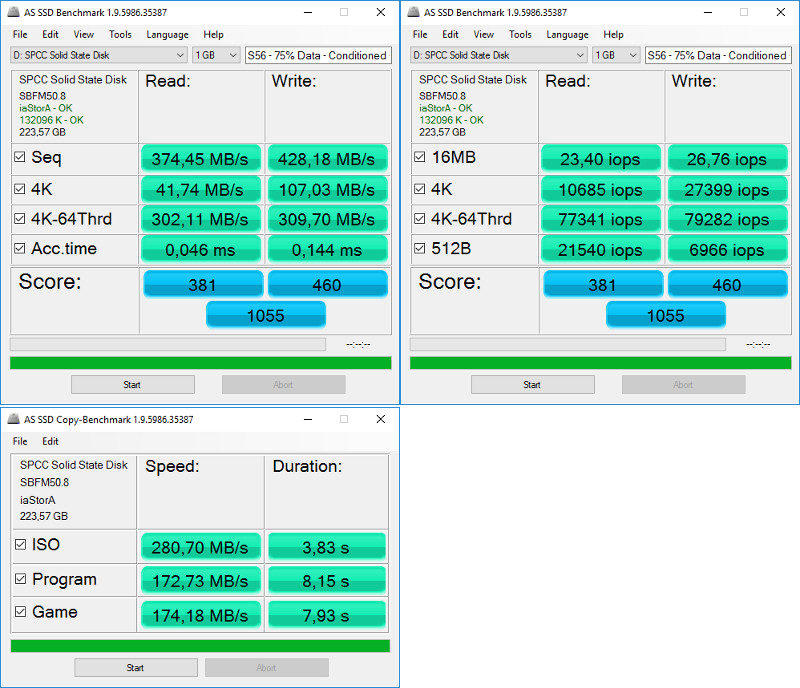
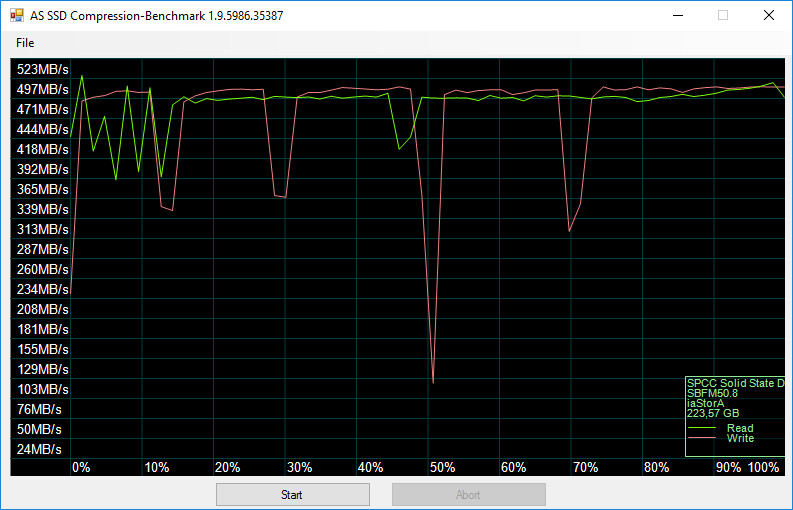
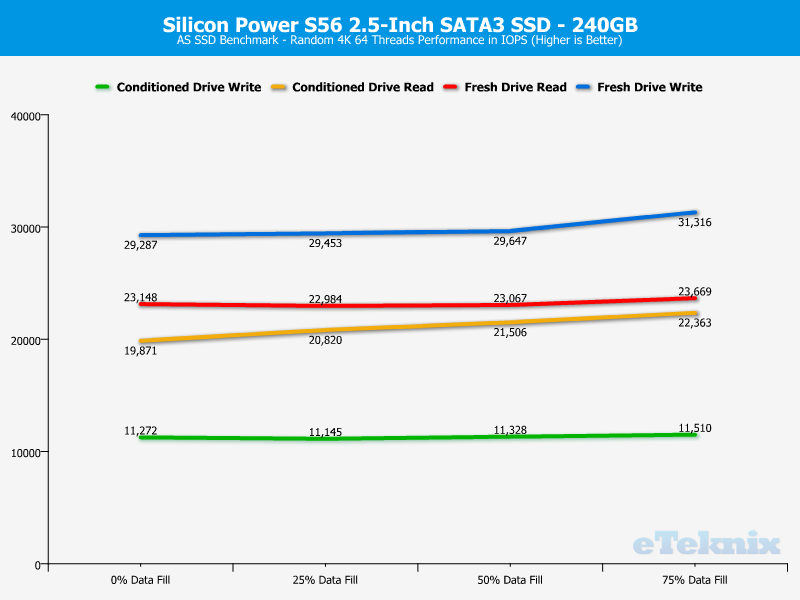
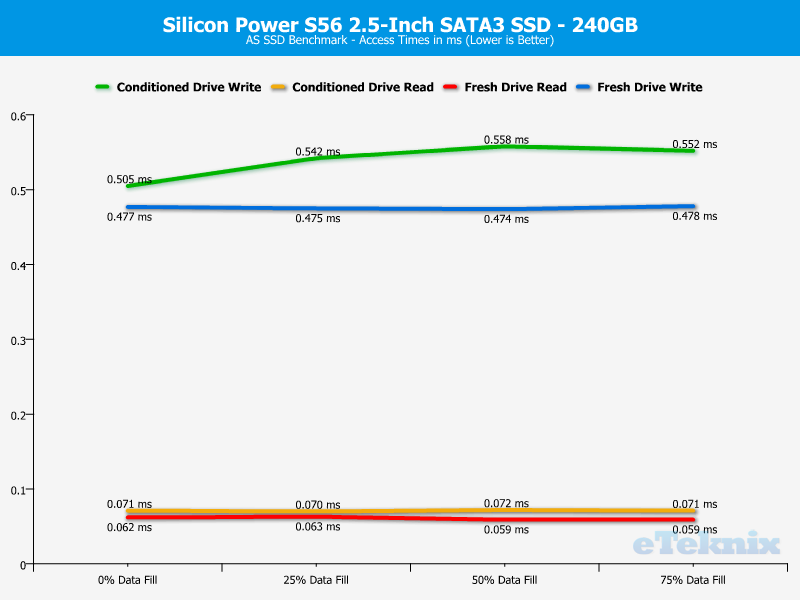
AS SSD Benchmark
The AS SSD software determines the performance of Solid State Drives (SSD). The tool contains five synthetic and three practice tests. The synthetic tests determine the sequential and random read and write performance of the SSD. These tests are performed without using the operating system caches. In Sequential tests, the program measures the time it takes to read and write a 1 GB file respectively. To give a clearer picture of the drives tested, I’ve chosen to include all tests. Special the copy test is one that I think is relevant on the consumer level as it gives the user a view into one of the operations he’s going to do many times.
Fresh Drive
Conditioned
Drive Performance Analysis
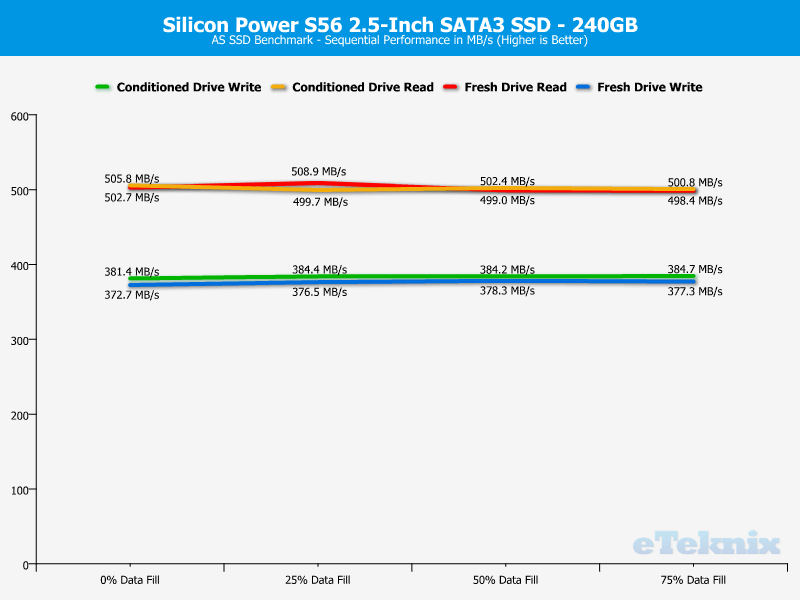
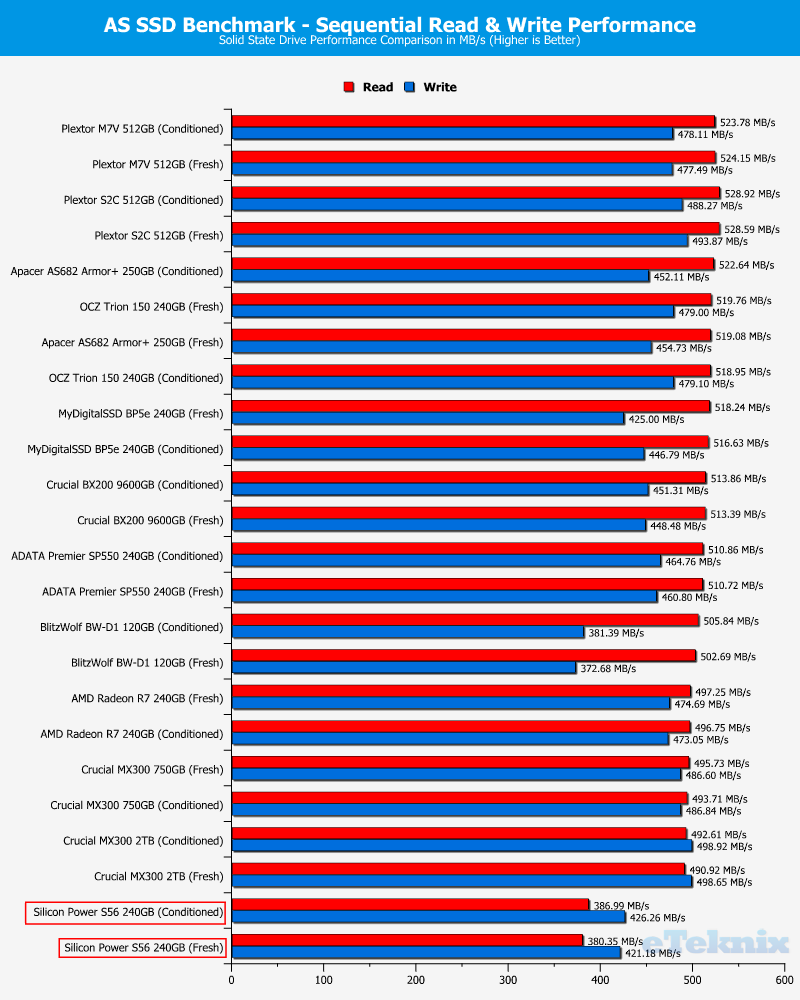
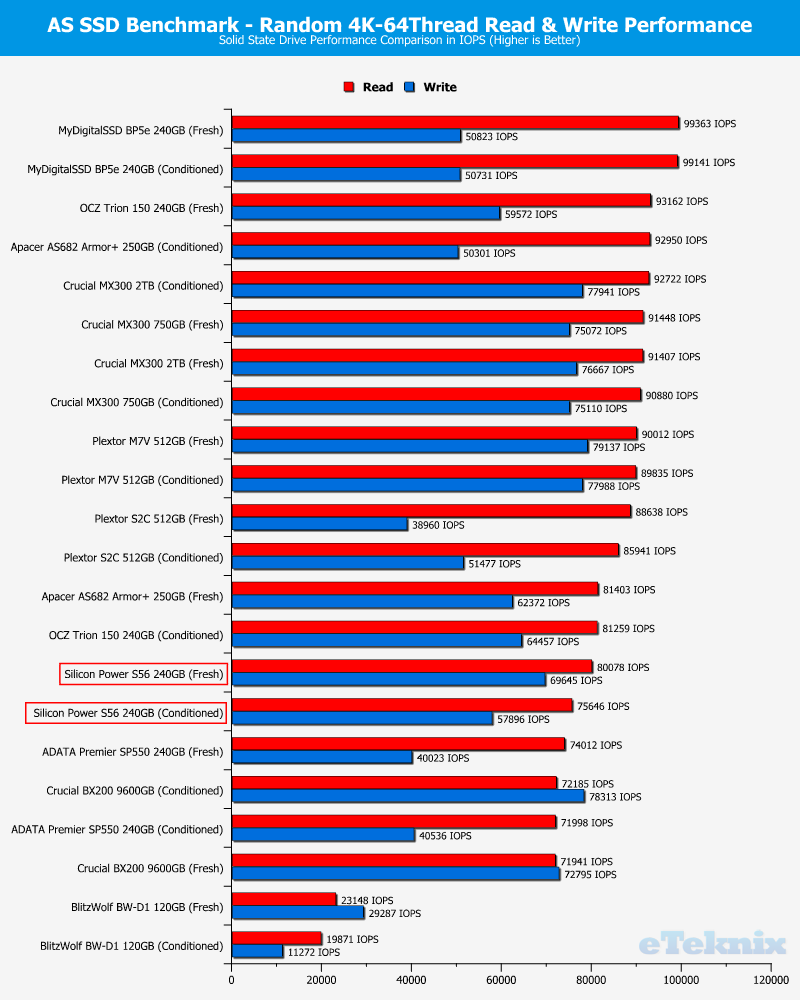
Drive Comparison
For the purpose of drive comparison, I will be using the performance figures from both unconditioned and conditioned tests with 0% data-fill.
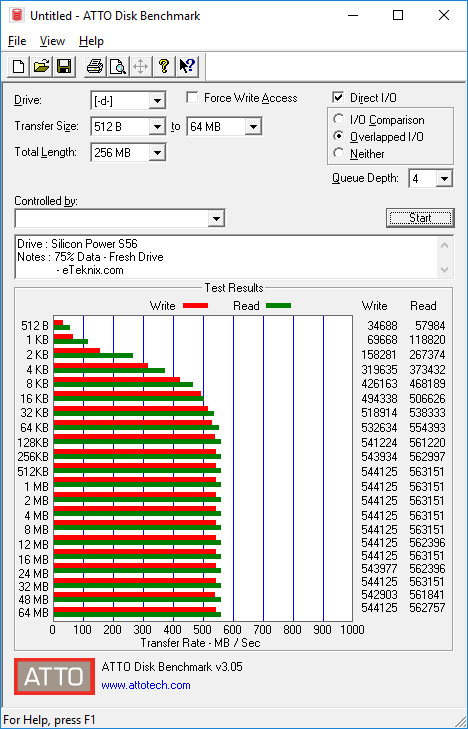
ATTO
The ATTO Disk Benchmark performance measurement tool is compatible with Microsoft Windows. Measure your storage systems performance with various transfer sizes and test lengths for reads and writes. Several options are available to customise your performance measurement including queue depth, overlapped I/O and even a comparison mode with the option to run continuously. Use ATTO Disk Benchmark to test any manufacturers RAID controllers, storage controllers, host adapters, hard drives and SSD drives and notice that ATTO products will consistently provide the highest level of performance to your storage.
Fresh Drive
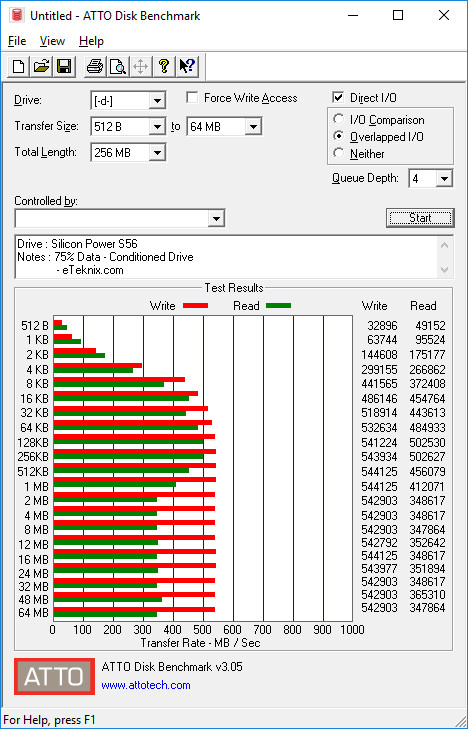
Conditioned
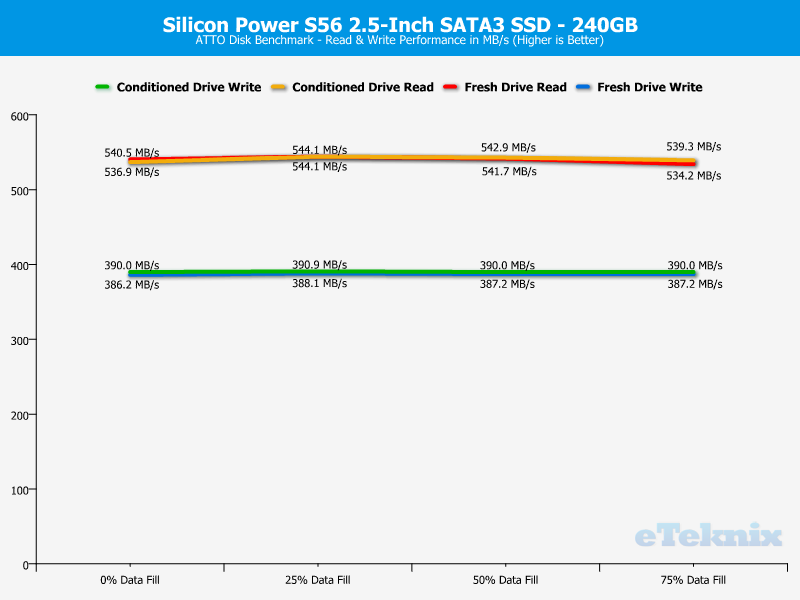
Drive Performance Analysis
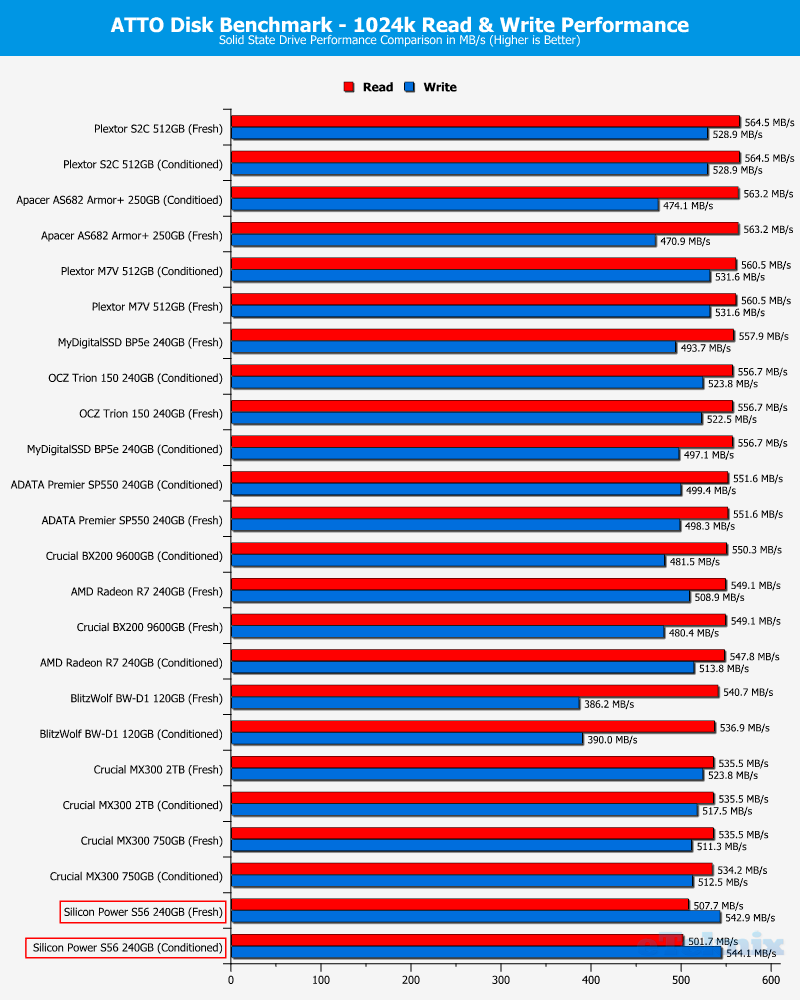
Drive Comparison
For the purpose of drive comparison, I will be using the performance figures from both unconditioned and conditioned tests with 0% data-fill.
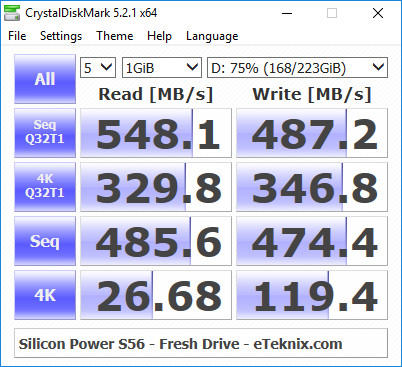
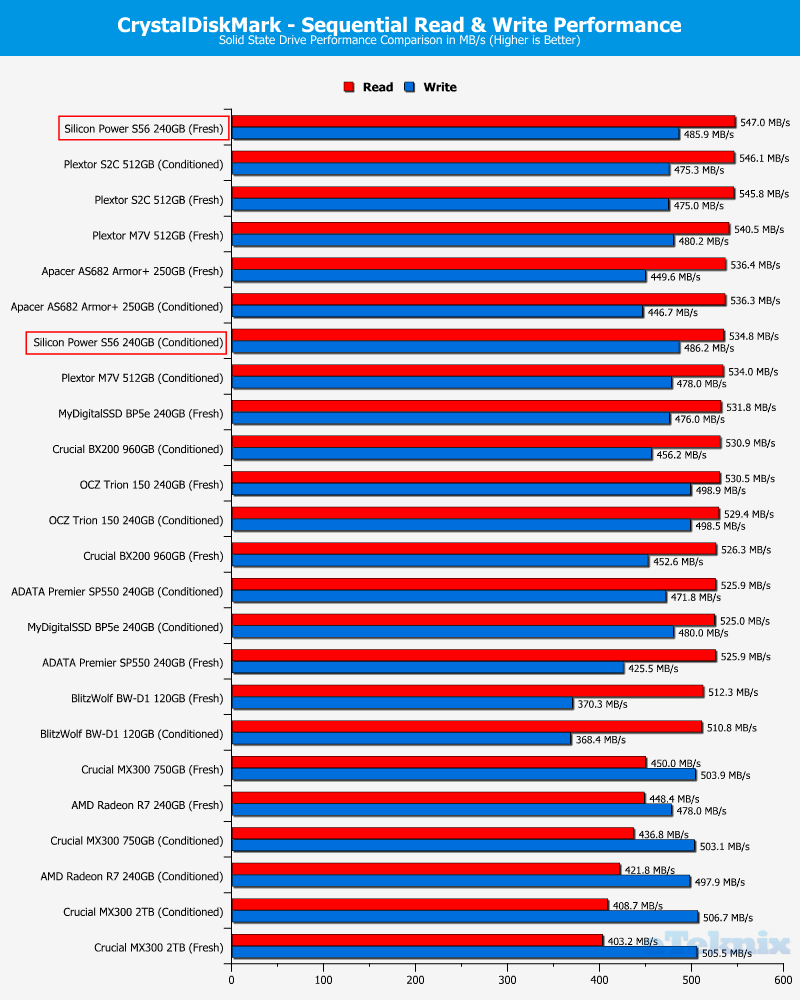
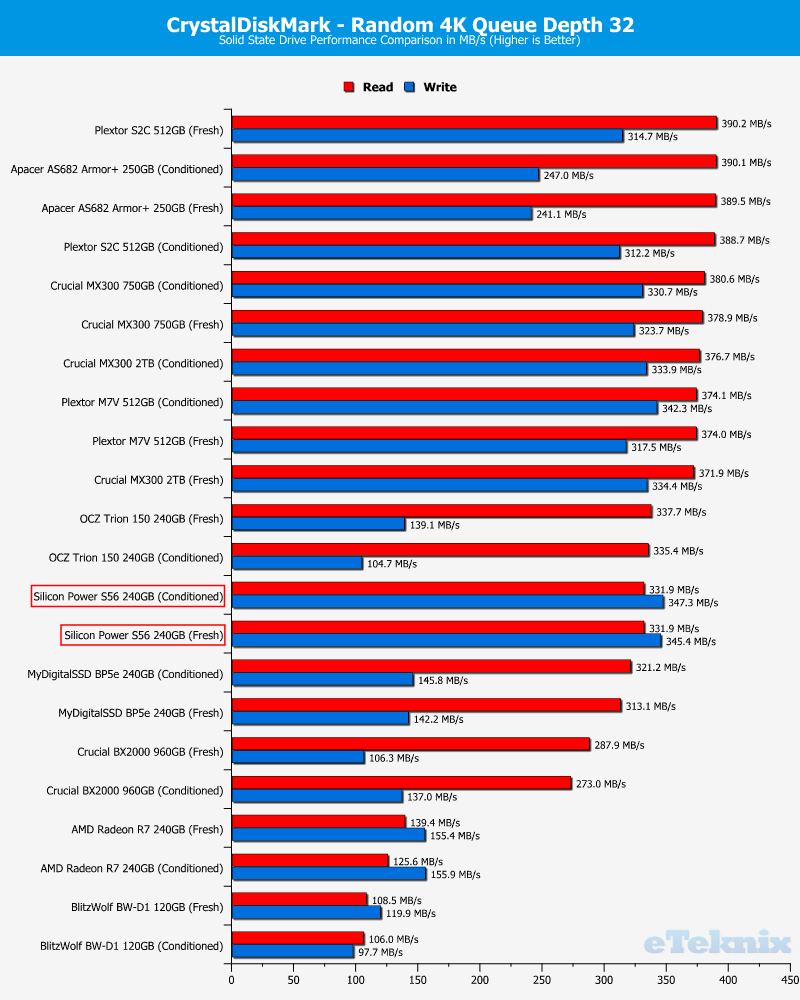
CrystalDiskMark
CrystalDiskMark is a small HDD benchmark utility for your hard drive. It enables you to measure both sequential and random read and write speeds.
Fresh Drive
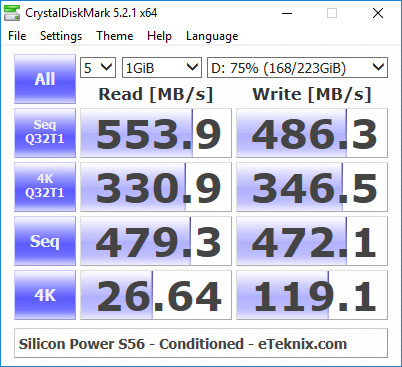
Conditioned
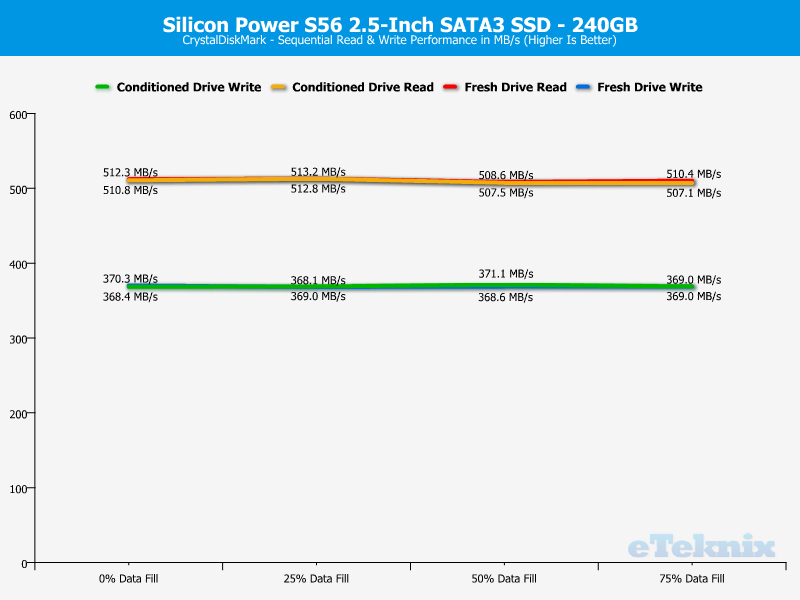
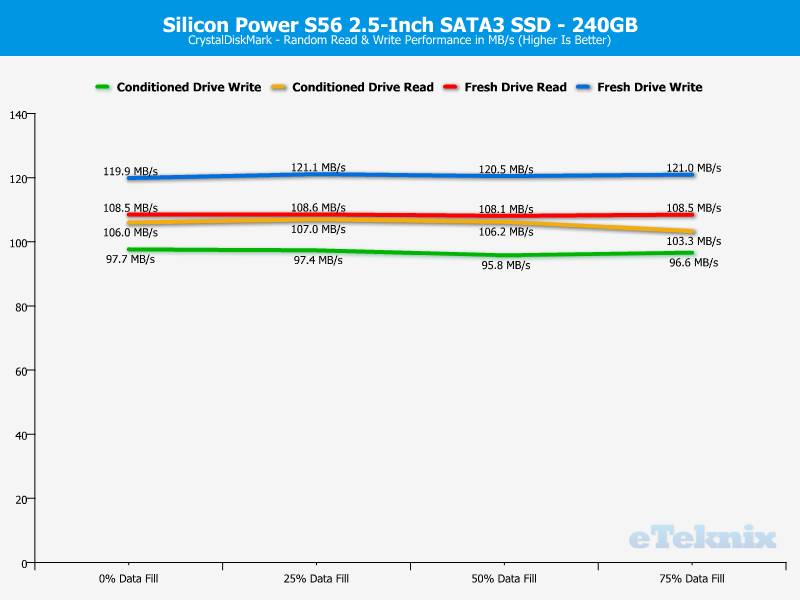
Drive Performance
Drive Comparison
For the purpose of drive comparison, I will be using the performance figures from both unconditioned and conditioned tests with 0% data-fill.
IOmeter & PCMark 8
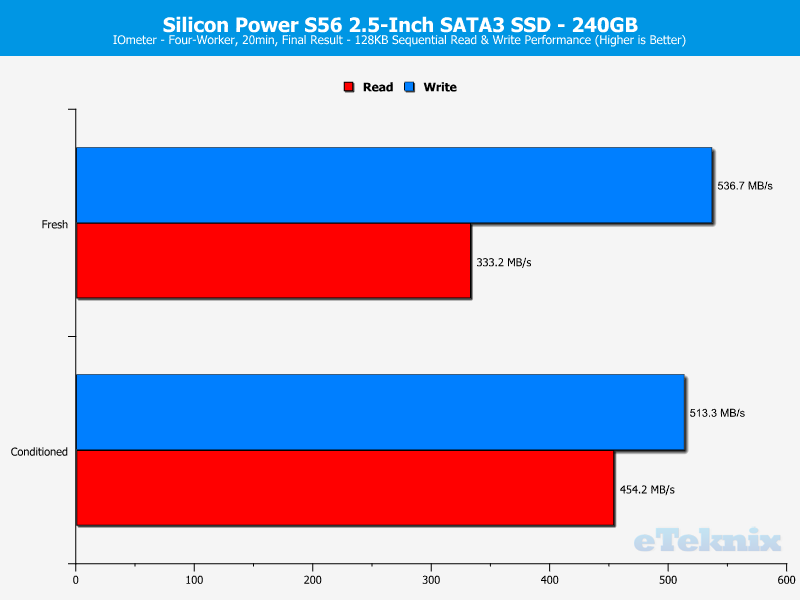
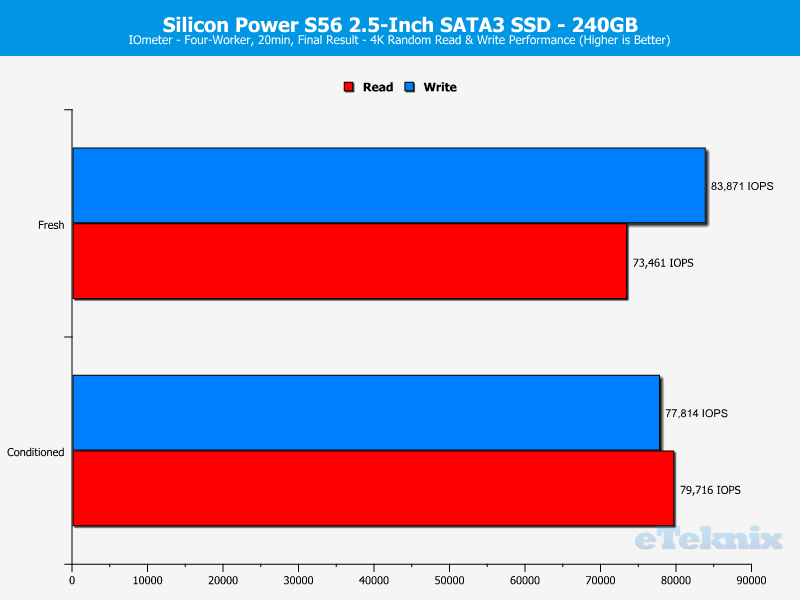
IOmeter
OMeter is an I/O subsystem measurement and characterization tool for single and clustered systems. It is used as a benchmark and troubleshooting tool and is easily configured to replicate the behaviour of many popular applications. One commonly quoted measurement provided by the tool is IOPS.
IOMeter allows the configuration of disk parameters such as the ‘Maximum Disk Size’, ‘Starting Disk Sector’ and ‘# of Outstanding I/Os’. This allows a user to configure a test file upon which the ‘Access Specifications’ configure the I/O types to the file. Configurable items within the Access Specifications are Transfer Request Size, Percent Random/Sequential distribution, Percent Read/Write Distribution, Aligned I/O’s, Reply Size, and TCP/IP status among others.
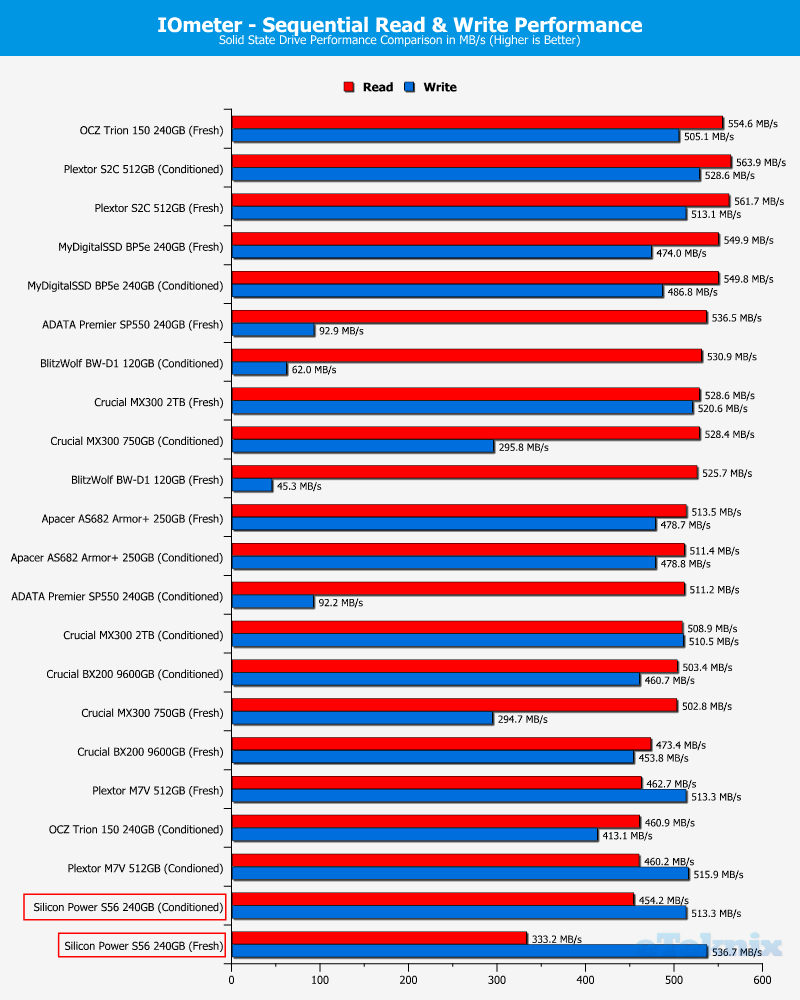
Sequential Performance
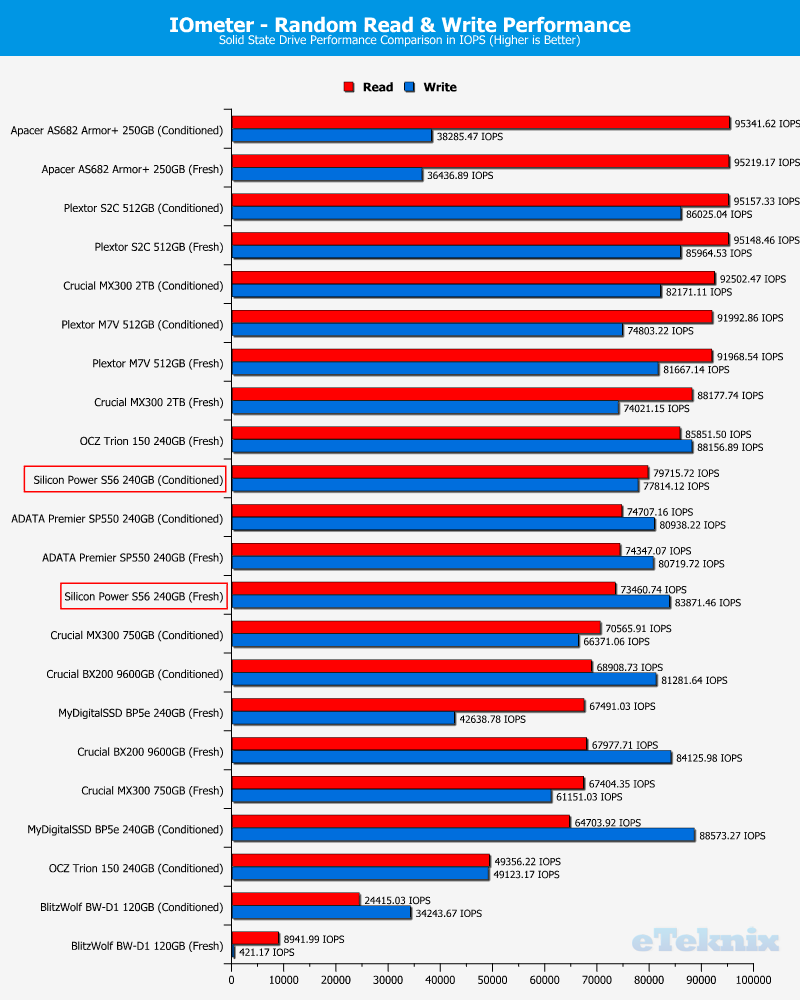
Random 4K Performance
Drive Comparison
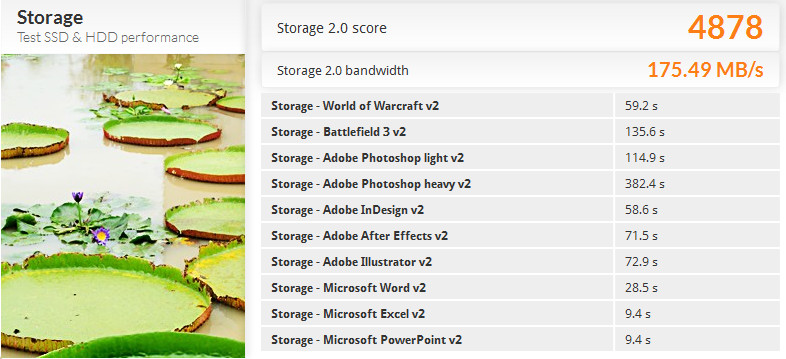
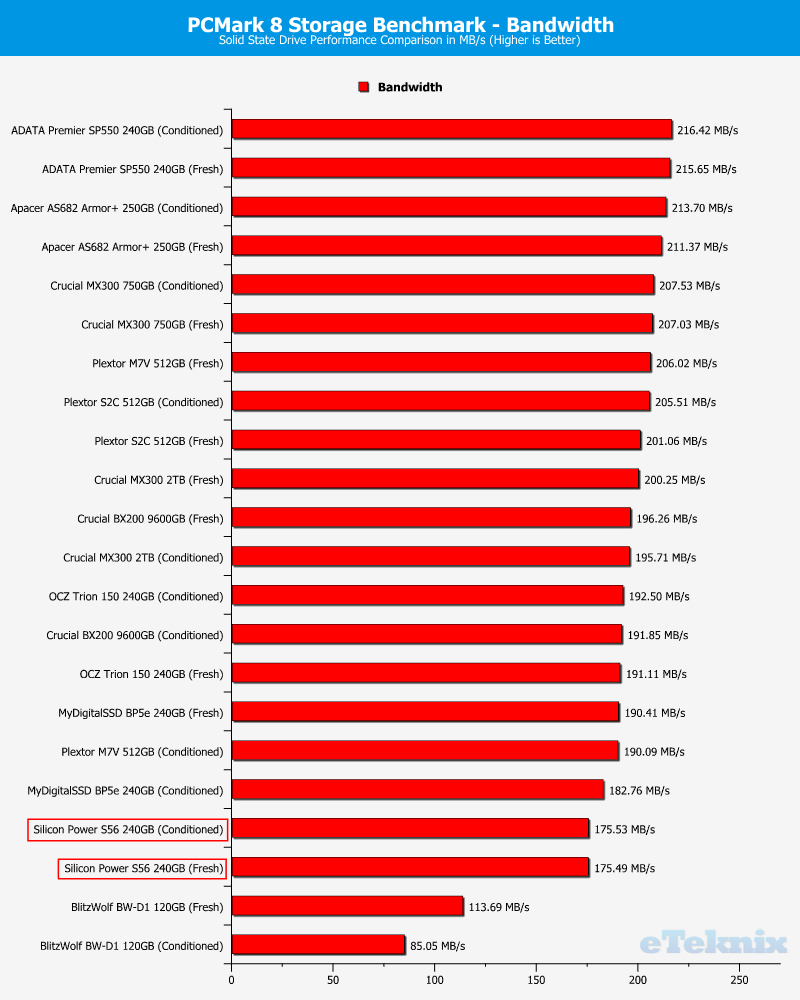
PCMark 8
PCMark 8 Storage benchmark is used test the performance of SSDs, HDDs, and hybrid drives with traces recorded from Adobe Creative Suite, Microsoft Office and a selection of popular games. You can test any recognised storage device, including local external drives. Unlike synthetic storage tests, the PCMark 8 Storage benchmark highlights real-world performance differences between storage devices.
Fresh Drive
Conditioned Drive

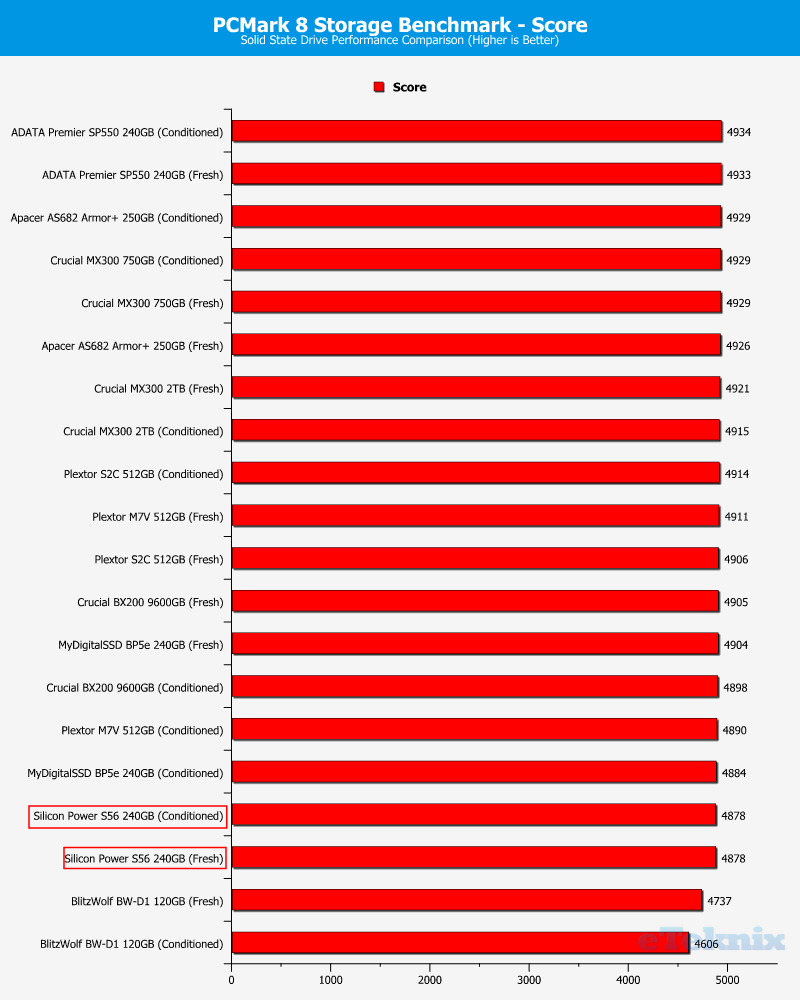
Drive Comparison
Final Thoughts
Pricing
At the time of writing, the Silicon Power S56 doesn’t seem to have arrived at the shops yet. I’ve reached out to SP for an MSRP instead, and I will update with that as soon as I get it.
Overview
The Silicon Power S56 is an entry-level drive, so we can expect it to be quite cheap. It is still a drive that performs well for its sector, and it would be a great replacement for your current mechanical hard drive. Capacity options up to 1TB also make this drive a great options for your game library.
Today I tested the 240GB capacity of this drive, and as we know, there might be better performance figures at higher capacities. The drive that I tested today still performed well and got some nice scores. The placement in the comparison charts varies a lot depending on test and runtime variables, and it shines most with compressible data and random access. The around 80K IOPS at both reading and writing is something that can make a big difference, and it is something that I noticed during the conditioning process. It finished a lot faster than expected for a drive of this calibre.
I quite like the design of the drive, and it is a fresher look than we’ve seen in the past from the previous S-series drives. While it only is a label, it will look better through your transparent case parts.
Pros
- Good random performance
- Best with compressible data
- Up to 1TB capacity options
- Error Correction Code
Cons
- Continuous sequential write operations on HDD level
“The Silicon Power S56 would be a great HDD replacement. Your full Steam Library on one SSD is just one of many usage scenarios.”
Thank you Silicon Power for providing us with this sample.