AMD Kaveri A10-7850K Overclocking Analysis
Ryan Martin / 10 years ago
Test Systems and Procedures
Test Systems
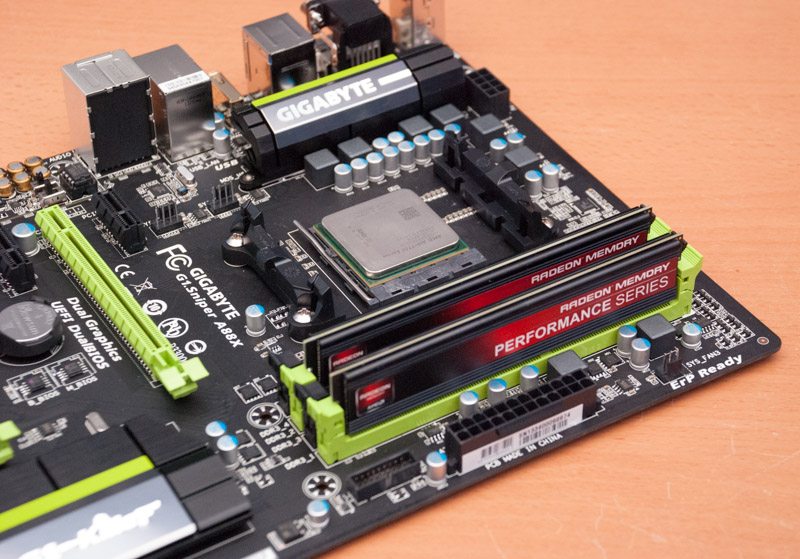
To tackle our AMD Kaveri testing we are using two main test systems, one for all the AMD APUs, thanks to the backwards compatibility, and one for the two Intel Haswell parts. We are using AMD’s FM2+ socket and A88X chipset with Gigabyte’s fantastic G1 Sniper A88X motherboard which we reviewed here. For the Haswell parts on Intel’s LGA 1150 socket we are using the Z87 chipset with MSI’s Z87I-Gaming motherboard, which we reviewed here.
AMD FM2(+) Test System
- Motherboard – Gigabyte G1 Sniper A88X FM2+
- Processor – A10-7850K, A10-7700K, A8-7600, A10-6800K, A10-6790K and A8-6500T all with Turbo Enabled
- RAM – AMD Performance Series Radeon Memory, 2 x 4GB DDR3-1866 with 9-10-9-27 (CL9) timings
- Graphics Card – None, integrated graphics only.
- CPU Cooler – Corsair H100i with Quiet Fan Profile and Noctua NT-H1 Thermal Paste
- Power Supply – Corsair HX1050W
- Main Storage Drive – Kingston HyperX 240GB SSD over SATA III interface
- Chassis – Lian Li T60 Test Bench
- Displays – Dell U2711 Ultra Sharp
- Operating System – Windows 7 Ultimate 64 Bit
Intel LGA 1150 Test System
- Motherboard – MSI Z87I-Gaming
- Processor – Intel Core i5 4440 (Turbo Enabled) and Core i3 4330 (Turbo not supported).
- RAM – AMD Performance Series Radeon Memory, 2 x 4GB DDR3-1866 with 9-10-9-27 (CL9) timings
- Graphics Card – None, integrated graphics only.
- CPU Cooler – Corsair H100i with Quiet Fan Profile and Noctua NT-H1 Thermal Paste
- Power Supply – Corsair HX1050W
- Main Storage Drive – Kingston HyperX 240GB SSD over SATA III interface
- Chassis – Lian Li T60 Test Bench
- Displays – Dell U2711 Ultra Sharp
- Operating System – Windows 7 Ultimate 64 Bit
We would like to thank Gigabyte, MSI, Intel, AMD, Corsair, Kingston, Lian Li, Noctua and all our other partners who supplied us with test system equipment and hardware. Their generosity makes our testing possible and without them we wouldn’t be able to produce the reviews we do, so thank you!
Test Procedures
To conduct this review we have a huge battery of tests, benchmarks and games to battle through. Below we have listed each benchmark and any associated details about how we run the test, how long for (if applicable) and any settings that may be helpful to know.
System Benchmarks
- PCMark 7 – the PCMark Suite preset of tests.
- PCMark 8 – the Home preset with Open CL acceleration enabled.
Open CL Benchmarks
- Basemark Open CL – Basic hardware optimisation running the full suite of tests on the GPU parts only.
- Compubench CL 1.1.3 – running only the Physics: SPH Fluid Simulation, Graphics: Raytrace and Vision: Optical Flow tests the GPU.
- Luxmark – Open CL computation running on the GPU and GPU/CPU combined hardware.
Productivity
- Photoshop CC – Smart Sharpen test of a sample image to test Open CL acceleration and image processing speed. Timed using digital stopwatch (old school!).
- Libre Office – spreadsheet computation and calculation performance.
- MuseMage – built in performance benchmark.
Gaming
- 3DMark11: Performance and Extreme presets.
- 3DMark (2013): Firestrike and Firestrike Extreme presets.
- Battlefield 4 – low preset at 720p (1280 x 720) and 1080p (1920 x 1080). Measured using fraps and a 2 minute sequence of the game in the middle of the first campaign mission. Replayed with as much duplication as possible to ensure accurate results.
- Tomb Raider – normal preset at 720p and 1080p, v-sync off, motion blur and screen effects on using the built in benchmark.
- Sleeping Dogs – normal preset at 720p and 1080p using built in benchmark.
- Bioshock Infinite – medium preset at 720p and 1080p using the built in benchmark.
- Batman Arkham Origins – normal geometry, everything else off. 720p and 1080p using the built in benchmark.
- Metro Last Light – Medium preset, AF4X and low motion blur at 720p and 1080p using the built in benchmark.
Power
- Power consumption – total system power draw measured with the system in an idle desktop state, with a CPU load state, GPU load state and CPU+GPU combined load state. Load states were all provided by the AIDA 64 Engineer system stability test.