AMD Ryzen 9 7900X Review
Andy Ruffell / 2 years ago

3DMark Firestrike
3DMark tests your system’s GPU and CPU performance by rendering extremely demanding game-like scenes in real-time. The faster the benchmark runs, the better your score. Now your quest begins. What can you do to get a better score?
3DMark is available on Steam here.
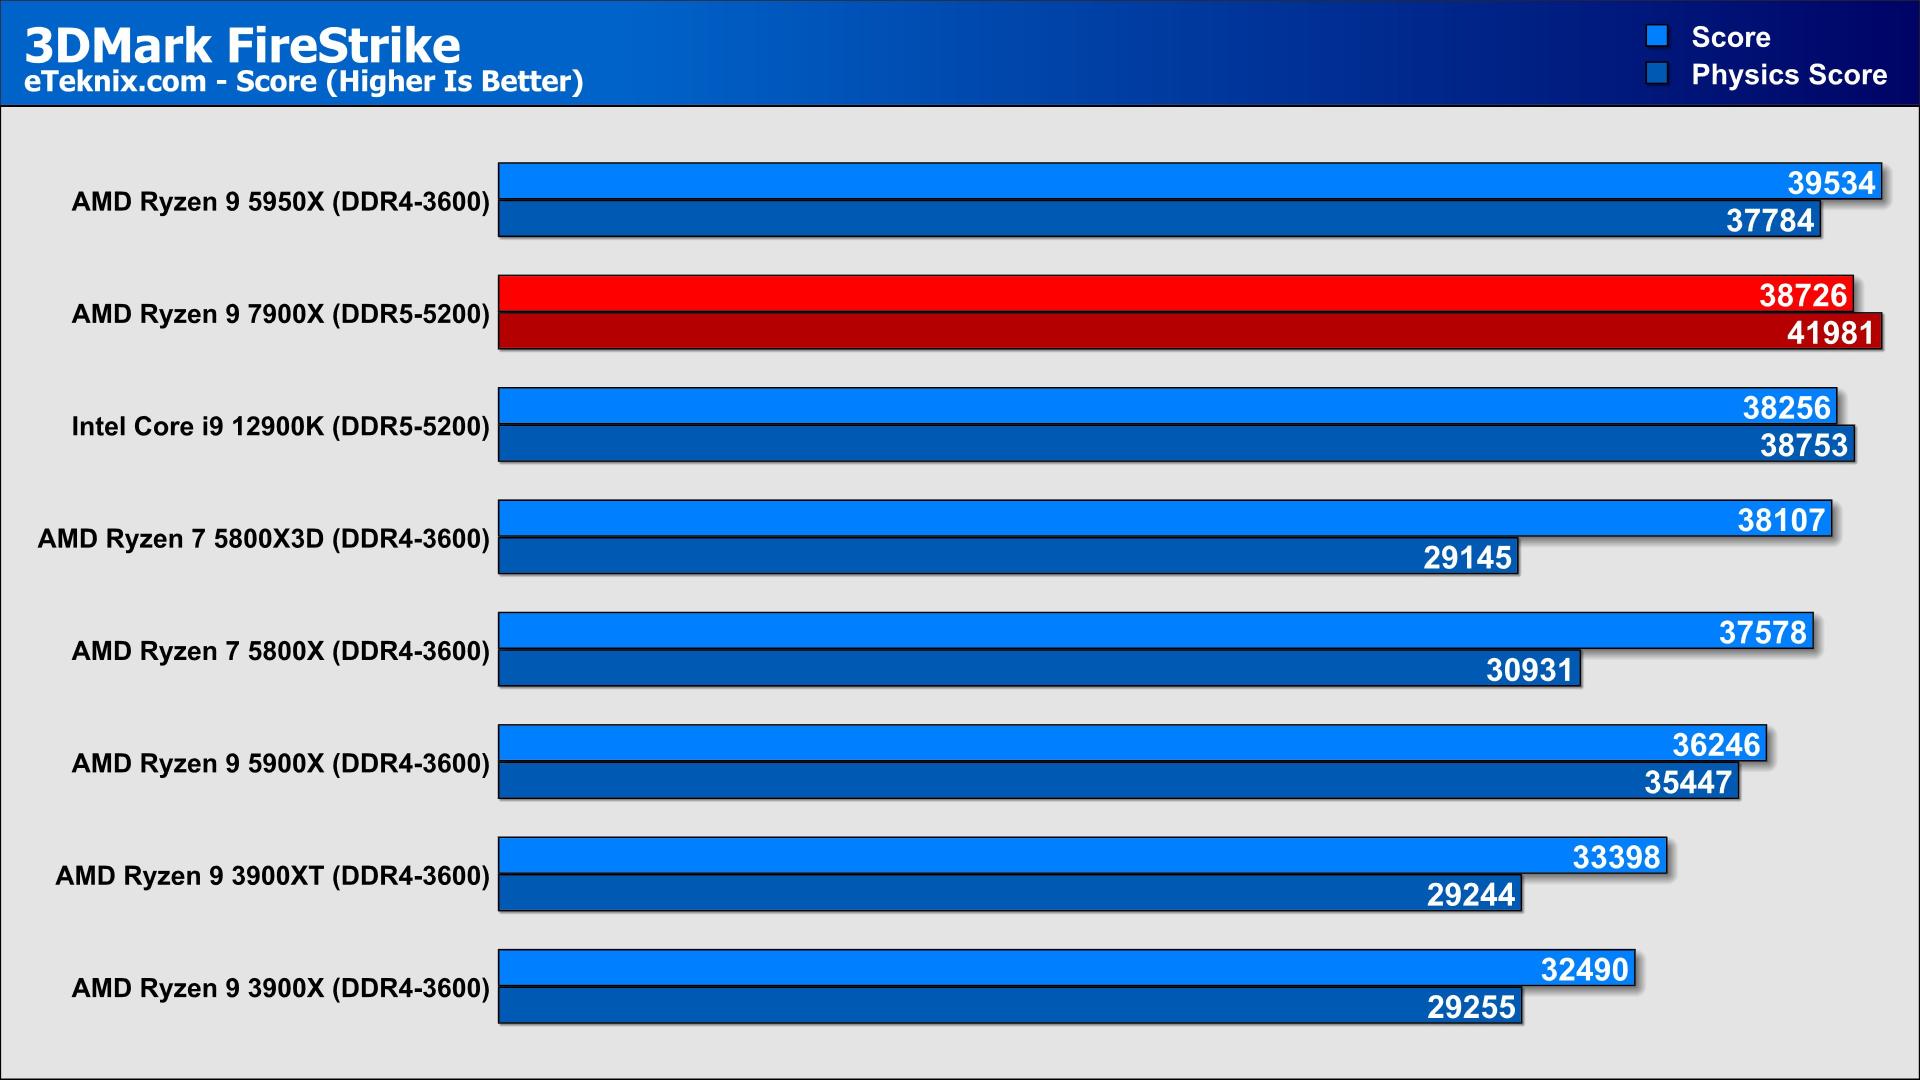
Moving over to synthetic benchmarks and in 3DMark FireStrike while we do see an improvement of around 6% generation to generation, it’s only barely enough to push ahead of the 12900K by around 1.2% and still sees the 5950X ahead of them all.
The physics score did come out dramatically better on the 7900X than the other processors tested, but not enough to make a noticeable difference in the overall score.
3DMark Time Spy
Time Spy is a DirectX 12 benchmark test for gaming PCs running Windows 10 and above only. With its pure DirectX 12 engine, built from the ground up to support the latest API features like asynchronous compute, explicit multi-adapter, and multi-threading, Time Spy is the ideal benchmark for testing the DirectX 12 performance of modern graphics cards and is typically a good benchmark for mid-to-high-end hardware. Furthermore, Time Spy Extreme is designed for 4K performance testing.
3DMark is available on Steam here.
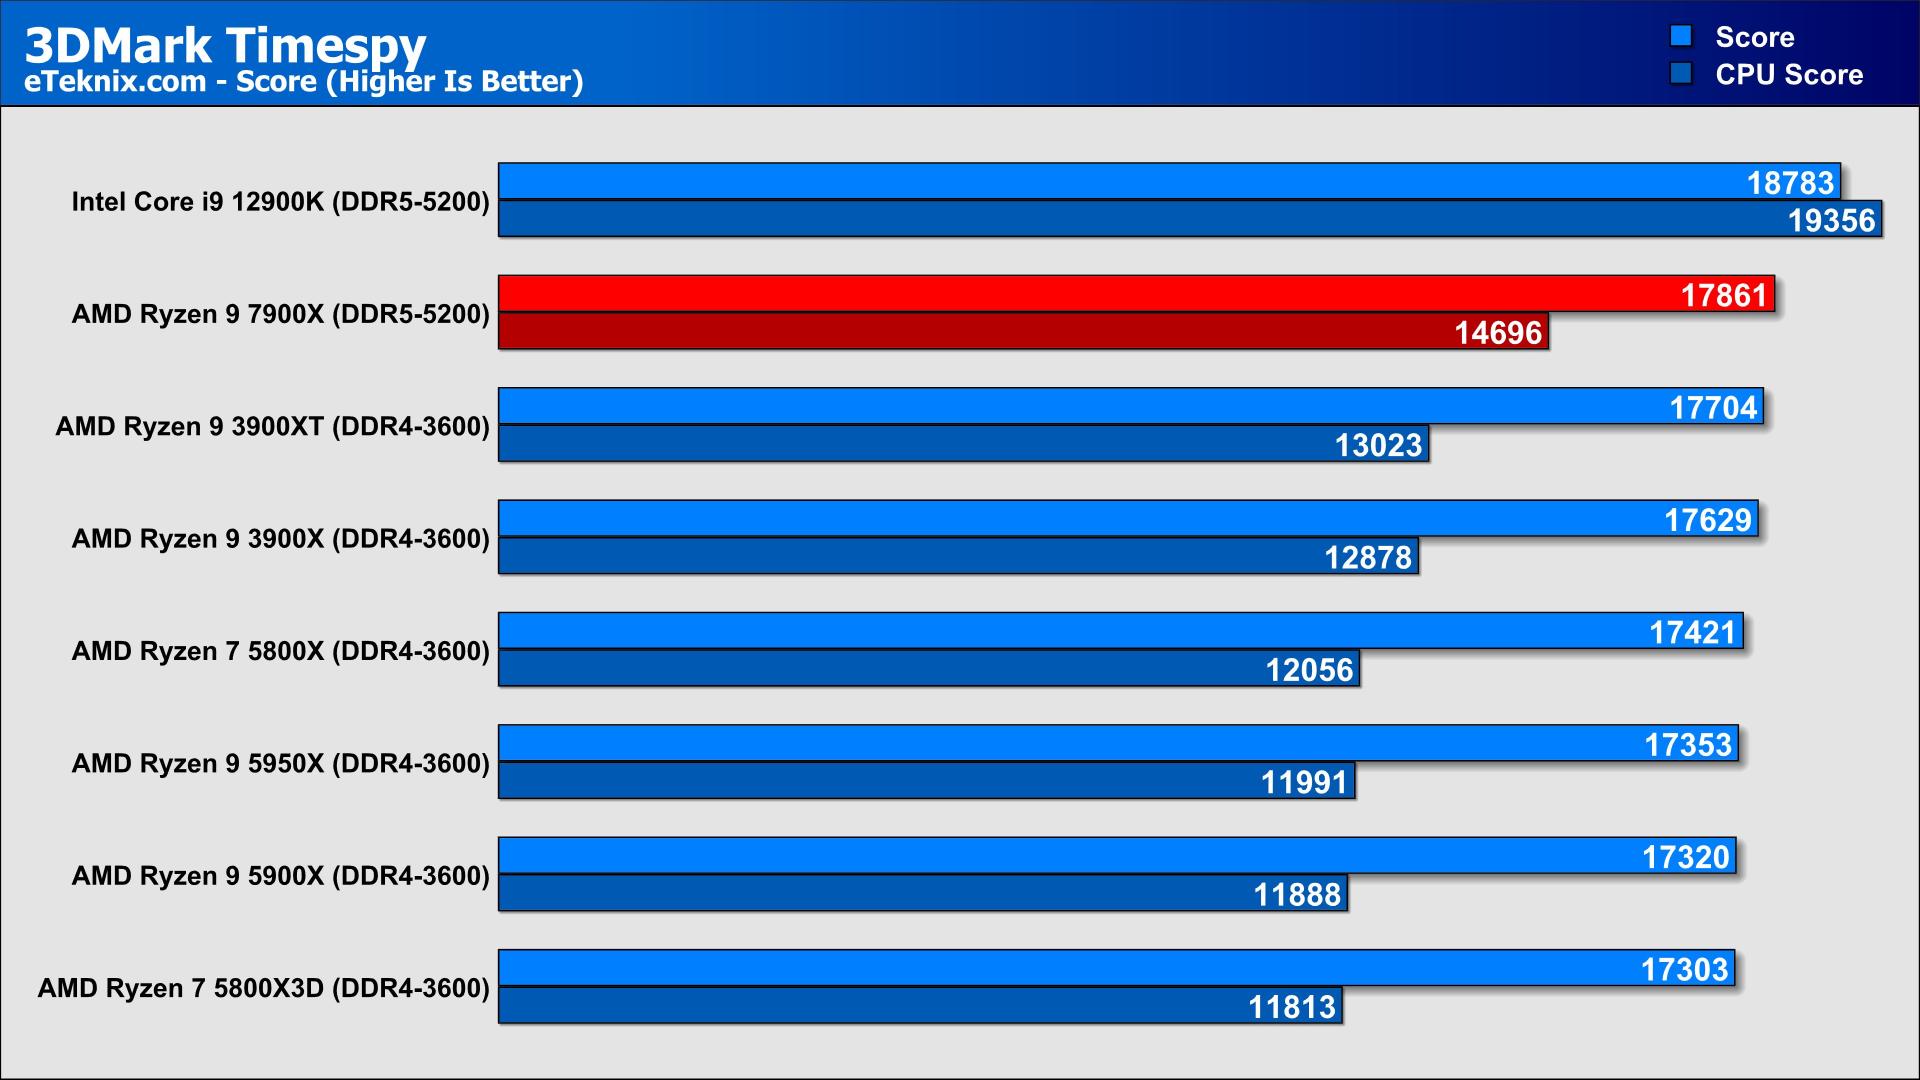
In 3DMark Time spy, we see a slightly smaller generational improvement of around 3% which drops slightly lower when looking at the performance uplift over the 5950X. When compared to Intel’s 12900K, the 7900X does fall a little short by around 5%, and in the CPU score, there’s a dramatic difference with the 12900K leading by 31%.
Geekbench 5
Geekbench 5 is a cross-platform benchmark that measures your system’s performance with the press of a button. How will your mobile device or desktop computer perform when push comes to crunch? How will it compare to the newest devices on the market? Find out today with Geekbench 5.
Available now on Geekbench.
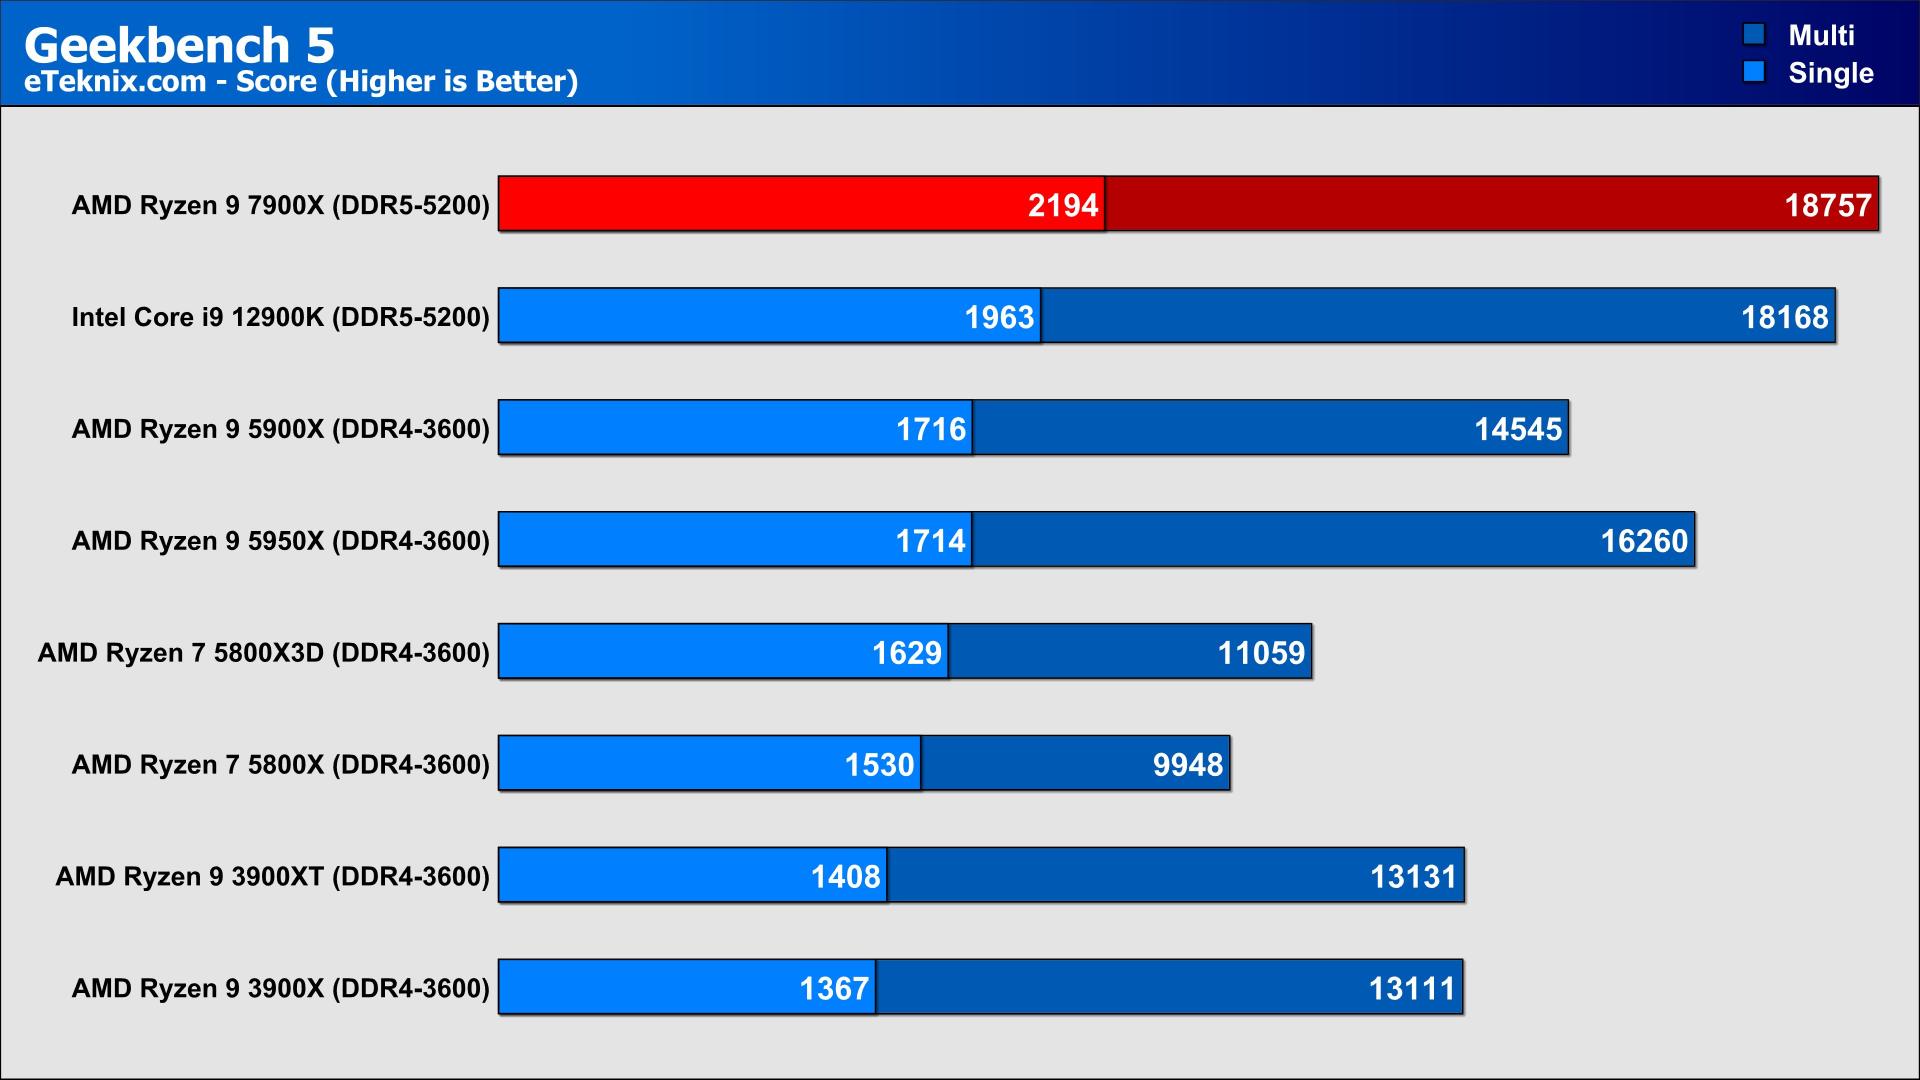
In Geekbench, looking at the single core performance, the 7900X holds a strong 11% lead over the 12900K and a 27 to 28% lead over both the 5900X and 5950X processors.
In multi-core performance, the lead diminishes with only a 3% lead over the 12900K, though the 7900X does manage to push ahead by over 15% compared to the 5950X Zen 3 flagship.
PCMark 10
PCMark 10 features a comprehensive set of tests that cover the wide variety of tasks performed in the modern workplace. With a range of performance tests, custom run options, Battery Life Profile, and new Storage benchmarks, PCMark 10 is the complete PC benchmark for the modern office.
Available now on Steam.
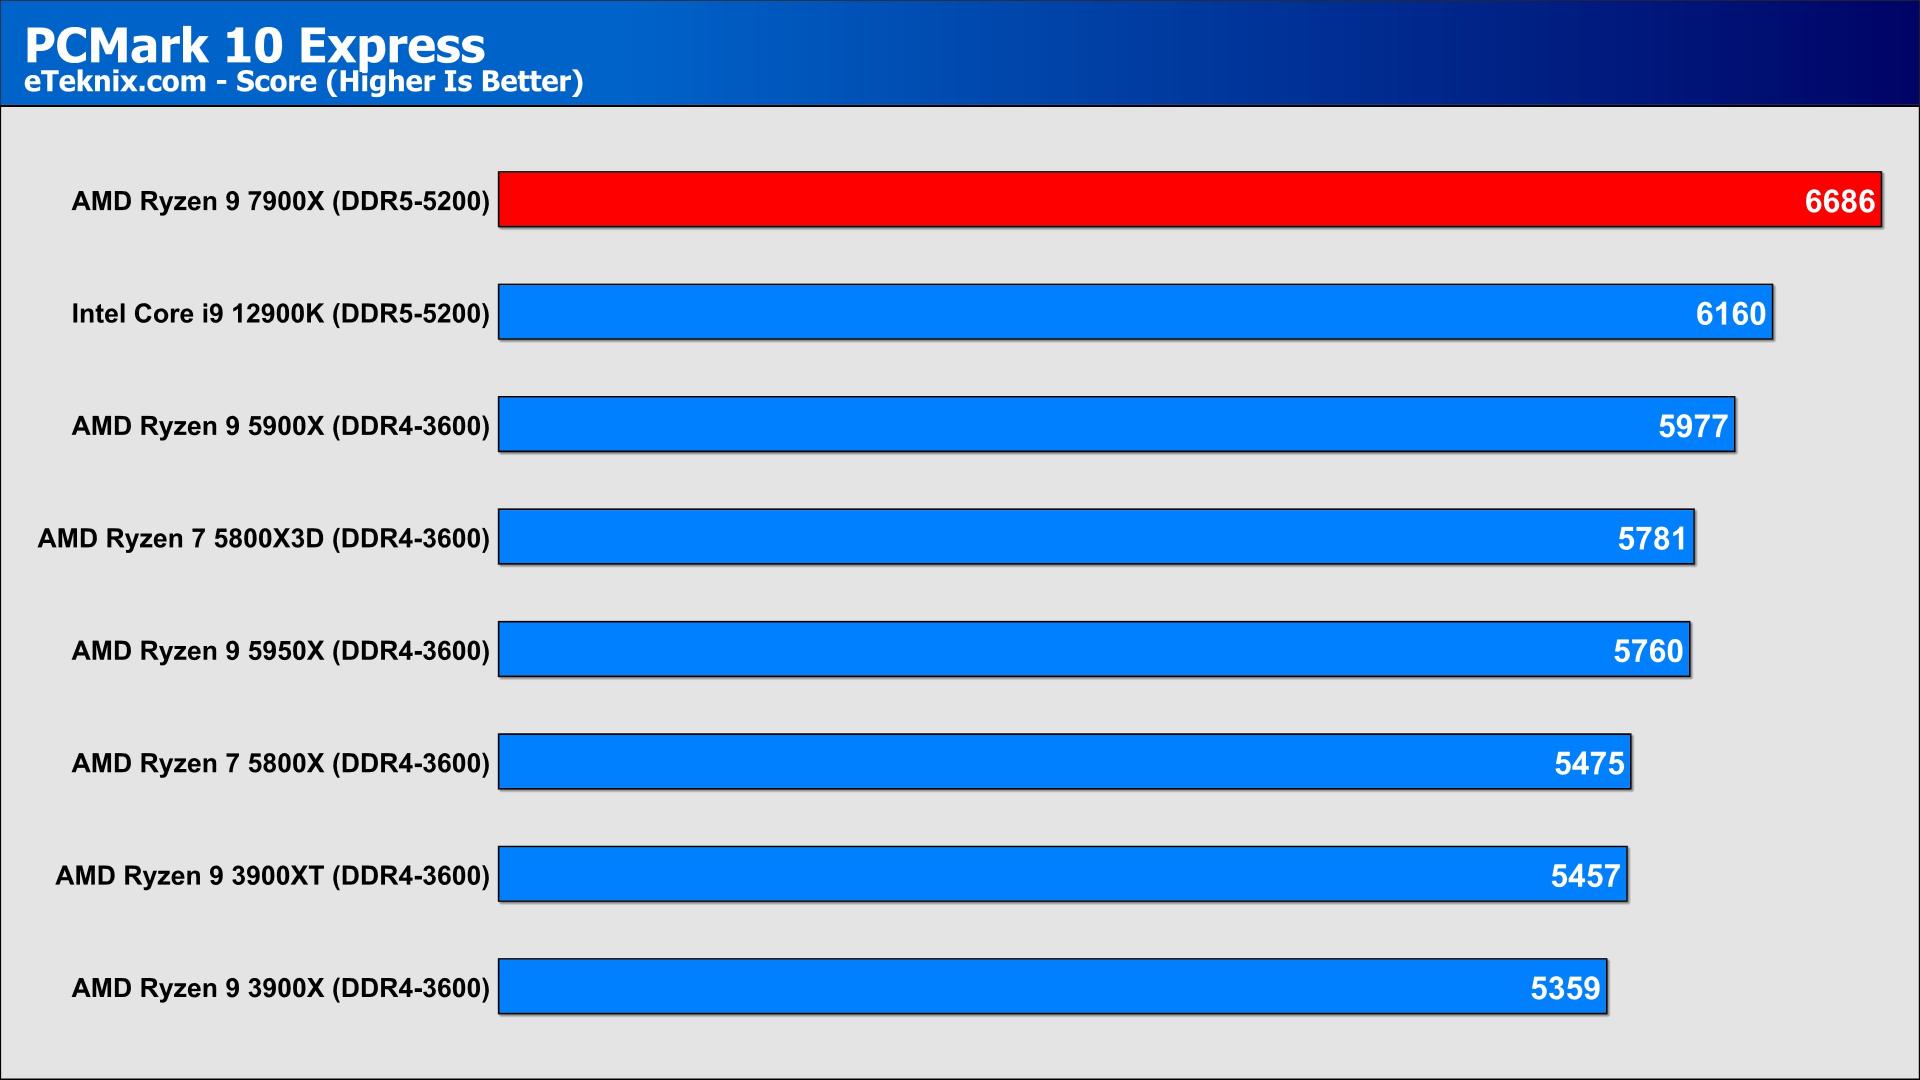
In PCMark 10 Express, we see a similar trend with an 11% performance lead over the 5900X and 16% lead over the 5950X. When it comes to the competition from Intel, the 7900X still has a comfortable 8.5% lead so I guess it’s safe to say that speed wins in this test.