Club3D R9 Nano 4GB HBMv1 Graphics Card Review
Rikki Wright / 9 years ago
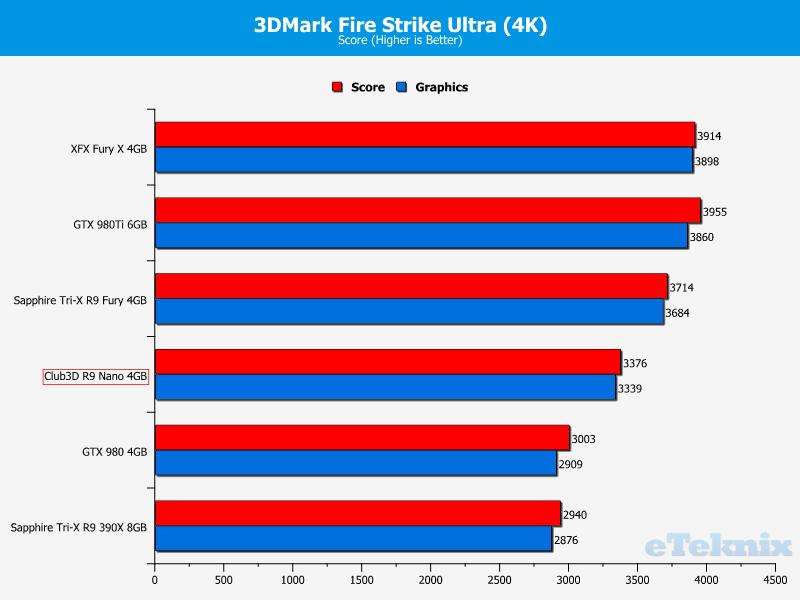
Synthetic Benchmarks
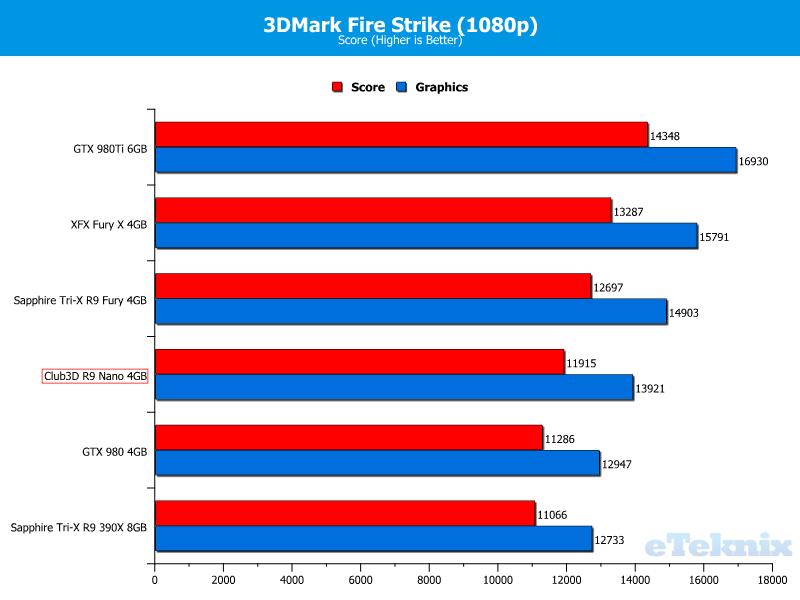
3D Mark
Our first test sees the trio pitted against 3DMark Firestrike. The performance curve is good here with a nice gap between them and the GTX 960.
The Inno3D card asserting a strong and early lead over the other two at 1440p.
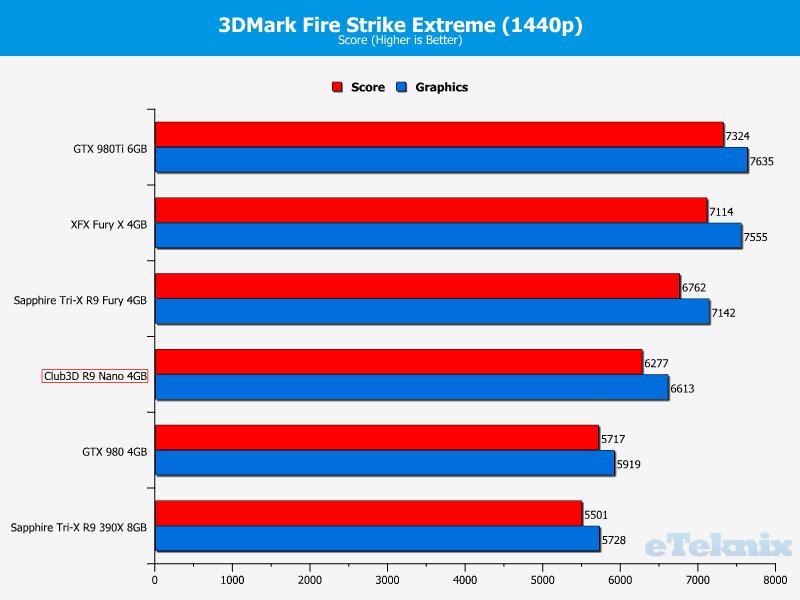
The lack of VRAM really hinders the cards here with a sharp drop; this pushes the cards down to bottom.
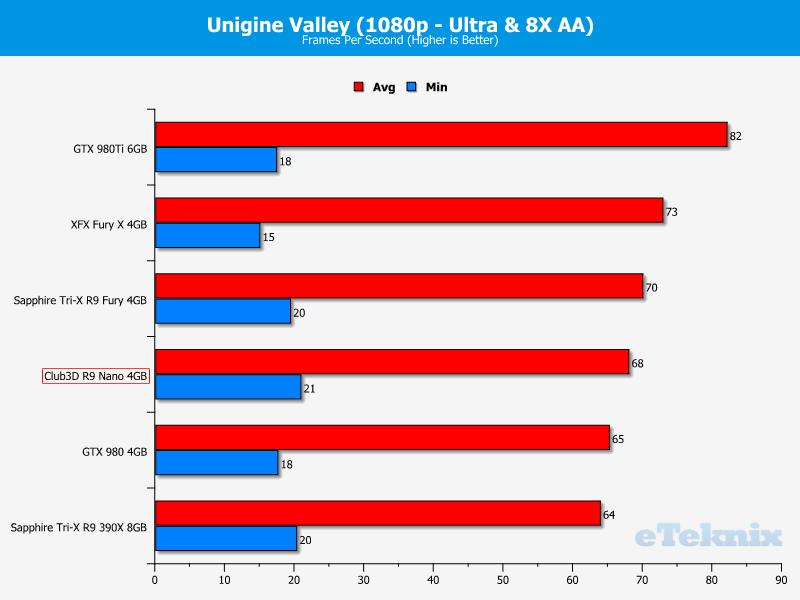
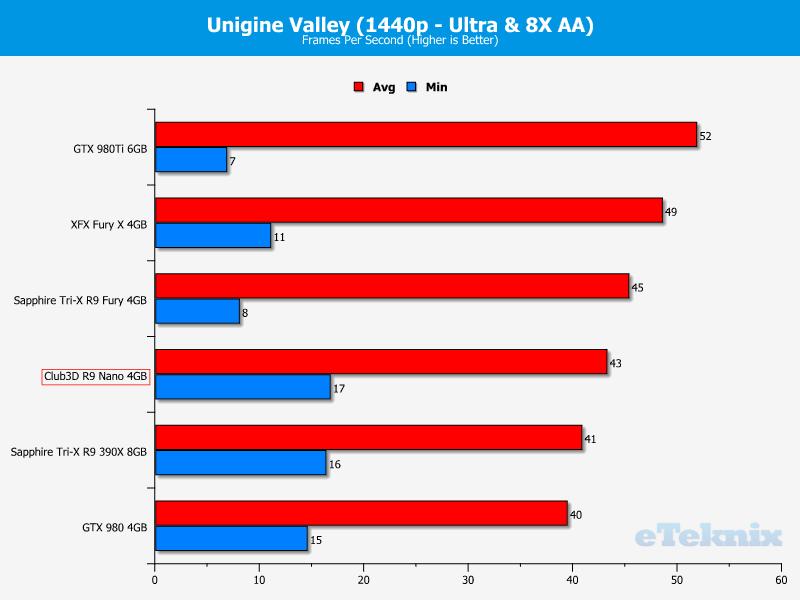
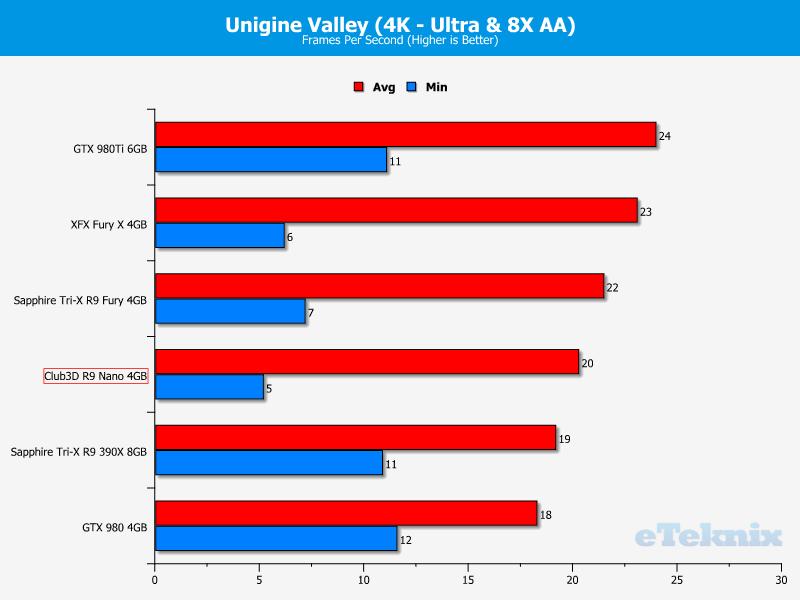
Unigine Valley

Unigine Valley isn’t a playable game, but it gives a much better view of the overall performance of the graphics cards. Through each test, it shows that the Nano is around 15% slower than the R9 Fury X and marginally slower than the R9 Fury.
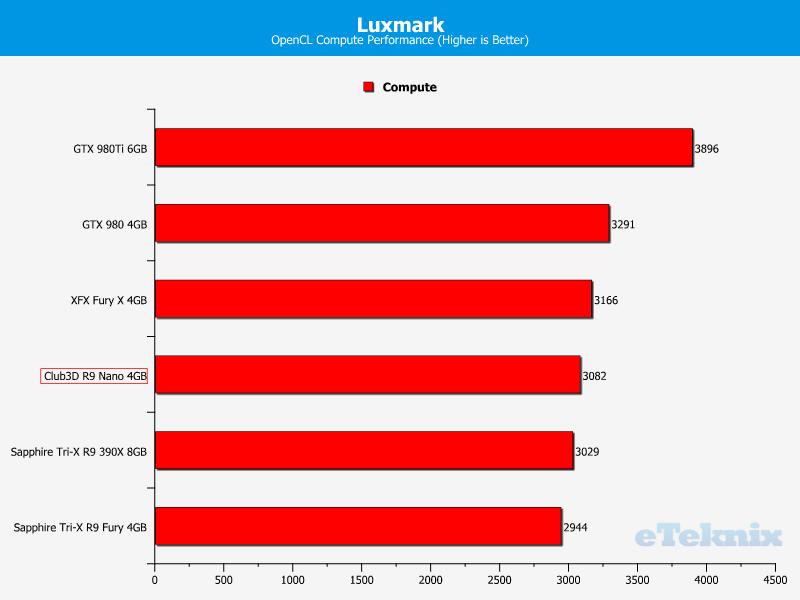
Compute Performance
Pitting the card at Luxmark and we can see that the Fiji core in the Nano is slightly weaker than the core in the R9 Fury X. However, rumours are circulating that AMD has chosen only the strongest Fiji units that can perform roughly the same as the R9 Fury X on much less power. It seems that the rumour may be true.