Nvidia LDAT & PCAT – What Are They?
Peter Donnell / 11 months ago
How Does FrameView Work?

The software is designed to run in the background, triggered by a macro/shortcut key of your choosing. Hit the button while gaming or running a benchmark, and it’ll record data for the amount of time you set. From here, it’ll look at the rendered frame rate throughout the graphics pipeline. This will help the software calculate the 90th, 95th and 99th percentile frame rates.
Ideally, graphics card reviews use the 99th percentile, and if frame rates are close to this average, the gameplay is typically smooth, if it’s not, that is likely when you see micro stutters etc. This is a better indication of overall performance while gaming rather than just peak frame rates.
- Rendered Frame rate: FrameView will measure and report timestamps at the beginning of the graphics pipeline. This metric indicates the smoothness of the animation delivered to the GPU
- Displayed Frame rate: FrameView will measure and report timestamps at the end of the graphics pipeline. This metric provides an indicator of what the user actually sees displayed on screen
- 90th, 95th and 99th Percentile Frame rates: Reviewers typically use 99th percentile calculations to determine whether a game’s minimum frame rate or frame time is close to its average.
If the 99th percentile frame rates are close to the average, the game is smooth and consistent. If they’re not, the game’s frame rate is likely inconsistent, resulting in micro-stutter during gameplay, negatively affecting your experience - Rendering Present Latency: Rendering Present latency is the time from when present was called on the render thread to when the present was actually completed by the GPU. This measurement includes the driver’s latency, how long the command sat in the queue waiting for the GPU to render, and the actual GPU render time. Rendering latency can help determine how responsive a game can feel to an end-user.
What About PCAT Testing?
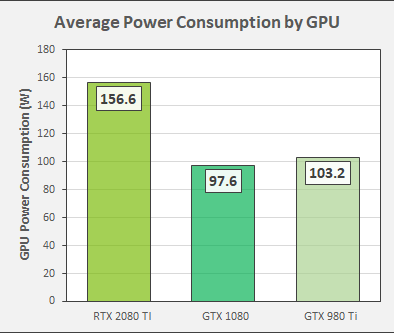
Not everyone cares about how efficient their graphics cards are, but you really should, as they can be pretty expensive components to run for extended periods of time. By integrating PCAT data, you can calculate the Performance Per Watt or PPW of your graphics hardware. PPW is recorded every 100 milliseconds by the sensor and software, and you can see how this is calculated in the equation below.
F/J = (F/S) / J/S):
F/J = Frame Rate ÷ Joules
One Joule: the equivalent of one watt of power radiated or dissipated for one second
(F/S) = Frames per second (FPS)
(J/S) = Watts per second (TGP)
Performance per Watt = FPS ÷ TGP
CHP chip power data is also available in the saved log files, should you need it.


