Silicon Power SP P34A80 1TB M.2 NVMe SSD Review
Bohs Hansen / 5 years ago

It has been a couple of months since I had an M.2 NVMe drive in the office which makes today a joy. I have Silicon Power‘s SP P34A80 2280 M.2 NVMe SSD here for a closer look at some benchmarks. The drive is available with up to 2TB capacity, but it’s the 1TB version I have in the office.
Silicon Power SP P34A80
The SP P34A80 is a drive that is compatible with most modern systems thanks to its 2280 M.2 form factor. All that is required is that your motherboard or adapter supports PCIe-based drives. The SP P34A80 comes in four different capacity options, 256GB, 512GB, 1TB, and 2TB, which should allow close to anyone to get the wished capacity for their system.
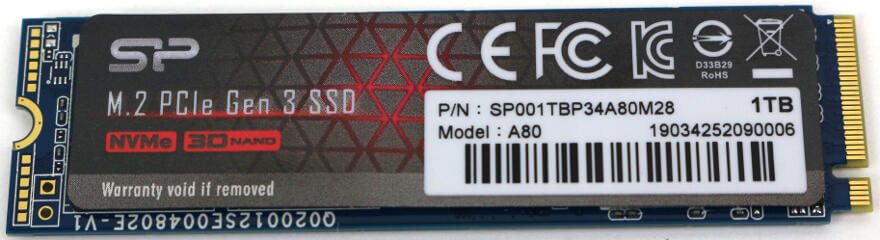
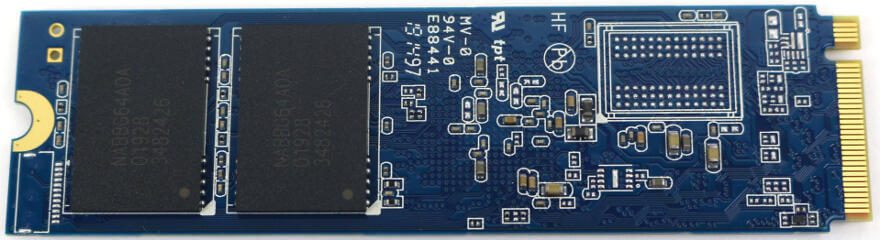
Silicon Power built the drive with Phison’s E12 controller and paired it with Toshiba’s BiCS3 64-layer TLC NAND. Both are quality components which we’ve seen in other drives before. There’s also a DRAM buffer which helps with the speed boosts and also an SLC cache. The controller also features a RAID engine which helps when the drives are paired in such setups. The PCIe Gen.3 x4 drive also supports the NVMe 1.3 protocol.
Performance and Endurance
Now, Silicon Power doesn’t provide us with a whole lot of details in the aspect of performance and endurance – but we do get some information. The drive is rated for a performance of up to 3400MB/s when reading and 3000MB/s when writing sequential data. The random performance is rated at 500K IOPS when reading and 600K IOPS when writing.
There is no official endurance rating, but Silicon Power backs the SP P34A80 with a 5-year warranty. With that in mind, we know it’s a drive that should last us a very long time and one that the company has confidence in.
What Does Silicon Power Have To Say?
“Step Up the Game to a New Level of Responsiveness. The full capacity P34A80 takes high-end devices to a whole new level of performance and responsiveness. Supporting the super-fast PCIe Gen 3×4 interface, it reaches incredible read and write speeds of up to 3400MB/s and 3000MB/S leaving PCIe Gen 3×2 and SATA III behind by a huge margin and high-power users with nothing better to wish for. It’s the ultimate addition to your performance gaming arsenal.”
You can read more about the drive and its details on the official product page.
Feature Highlights
- Available with up to 2TB
- Up to 3400MB/s performance
- High compatibility thanks to M.2 2280 form factor and NVMe 1.3 protocol
- Built with 3D TLC NAND
Package and Accessories
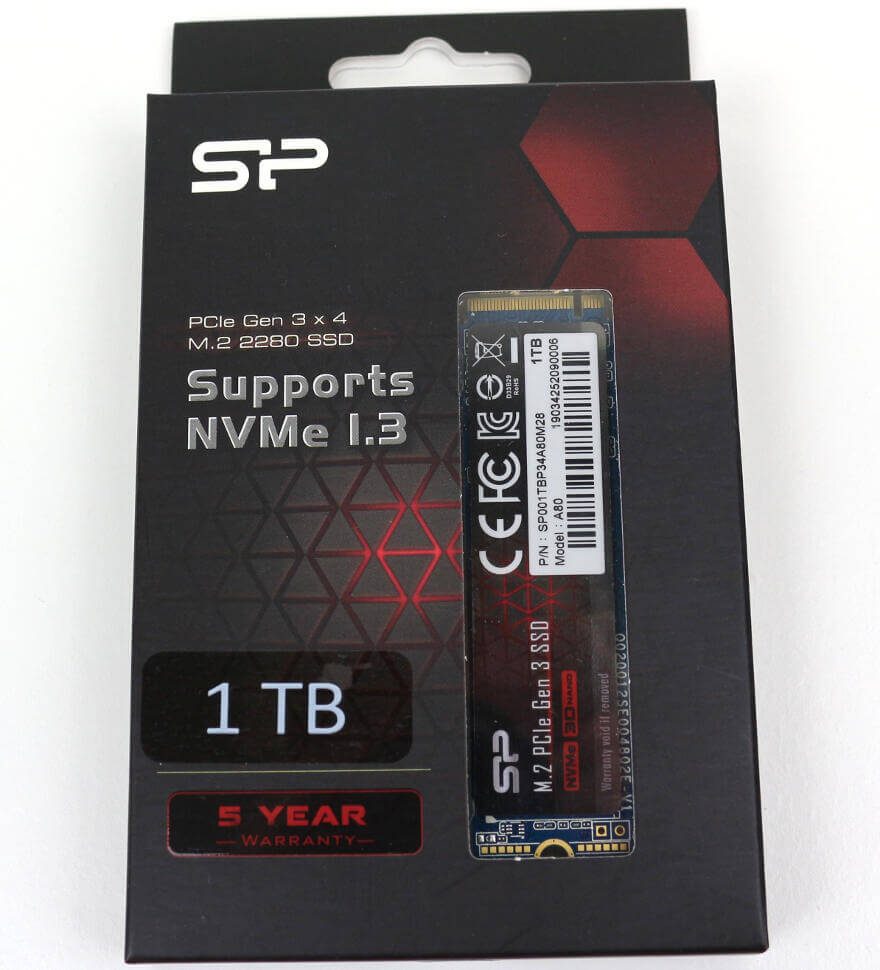
The P34A80 packaging is quite beautifully designed. The front has a transparent part allowing you to see the actually included drive while the box itself has the most vital feature highlights printed on the front. This includes the size and interface requirements along with the capacity and warranty.
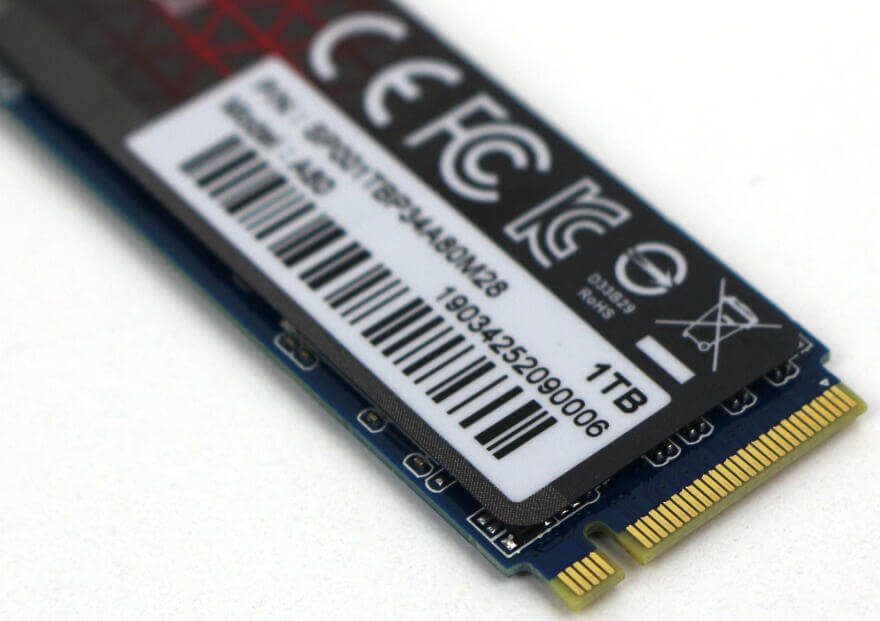
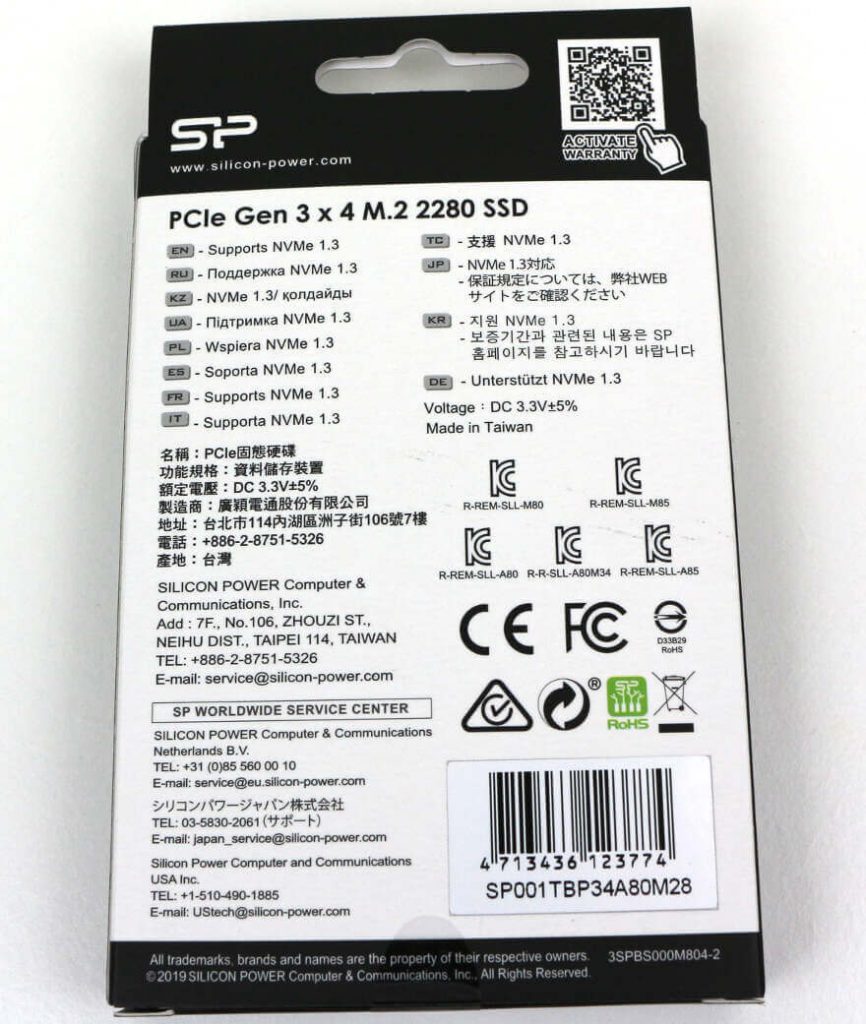
The rear side doesn’t have a whole lot of information, mainly the NVMe 1.3 compatibility in several languages. The rest is more of the legal aspect with all the certifications it has passed.
Testing & Methodology
In a bid to make our testing as thorough and as accurate as possible, we have devised a testing methodology that will give us the maximum amount of data. While this means that testing each drive will take considerably longer – easily up 36 hours – the overall picture that we can gather is bigger too. It helps both you as the reader and us as the reviewer’s to gain a clearer view of the drive’s overall performance, strengths, and weaknesses. It also provides a more accurate analysis of how each drive performs under different conditions.
Data Fillage
There are many ways to test a storage drive, and we have chosen to include close to every test possible. We will start with a typical benchmark analysis of the formatted drive with various village scenarios. However, depending on how a drive is built, the performance may differ depending on how much data it is already storing. Testing this, the drive will be tested empty as well as with 25%, 50%, and 75% space usage. For these tests, we will be using Anvil’s Storage Utilities, AS SSD Benchmark, ATTO Benchmark, and CrystalDiskMark.
Application and Gaming
Besides these synthetic fill tests, the drive is tested with PCMark 8’s storage benchmark to get real-world performance results.
Plain Drive Performance
Following the fillage tests, the partition gets removed, and we check the drive’s raw performance. These tests will determine the hardware’s capabilities while eliminating any interference from the set file system. AIDA64’s storage benchmark and IOmeter are both great tools for this, and they help us paint an even clearer picture of the drive. The IOmeter tests I run are quite different from the rest as they will give a final result after a longer performance test rather than a maximum or average score; this gives us yet another view of the tested drive over the regular tests.
Drive Conditioning
Durability is a vital factor when it comes to NAND-based drives as the chips only can be rewritten so many times before they’ll stop working properly. Modern SSDs come with wear-level algorithms to increase the lifetime and reduce this factor as much as possible. We also take this into consideration in our reviews even tho it would take years to simulate this under real-world conditions. Luckily, Anvil’s Storage Utilities comes with an endurance test that can perform this action much faster, but it is still a time-consuming process. Depending on the hardware, this can easily take several days, and we write thousands and thousands of small files in various sizes and compressibility to drive over and over.
Following this conditioning process, all of the previous benchmarks will be run again in the same scenarios and the same order. This will give us a great view of how a drive will perform after prolonged usage, and that is a very vital factor when you pick out your storage drive.
The Preparation and In Between
The drive will be formatted as NTFS with default settings, as most users will do. The quick format option isn’t used as that might affect the performance the first time data is written.
Modern operating systems all take care of the TRIM command in the background and it isn’t something to worry about for regular users. However, for these reviews, I will add a waiting period between each benchmark to make sure that the TRIM command has been fully executed and finished. After all, we want a clear picture of the drive’s performance with minimal interference from the operating system.
On each page that follows with the benchmark results, I have inserted result screenshots from the benchmarks, created drive analysis chart for the fill-level performance, and added drive comparison charts where possible.
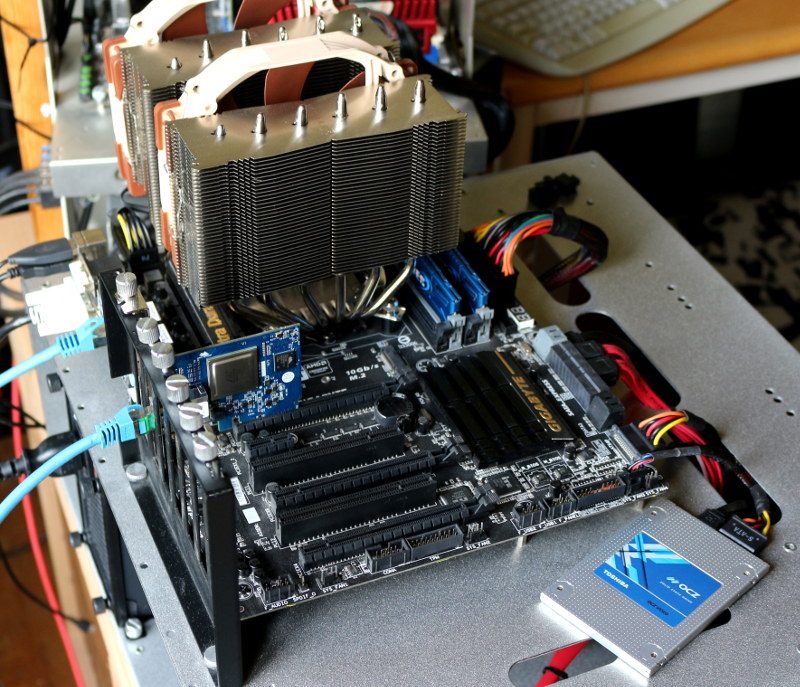
Hardware
- Supermicro C7Z270-PG
- Intel Core i7-7700K
- Crucial Ballistix Sport DDR4 2400MHz (4x8GB)
- Toshiba OCZ VX500 512GB SSD
- be quiet! Dark Power Pro 11 (1200W)
- Noctua NH-D15S
- Cooler Master HAF XB EVO with Noctua NF-A14 FLX fans
Software
- AIDA64 Storage Benchmark
- Anvil’s Storage Utilities
- AS SSD Benchmark
- ATTO Benchmark
- CrystalDiskMark
- IOMeter
- PCMark 8 Storage Benchmark
- Windows 10
AIDA64 Storage Benchmark
AIDA64 is a streamlined Windows diagnostic and benchmarking software for home users with a broad range of features to assist in overclocking, hardware error diagnosis, stress testing, and sensor monitoring.
The app has unique capabilities to assess the performance of the processor, system memory, and disk drives and is compatible with most Microsoft Windows operating systems. It also has a disk benchmark tool, and that is the one I’ll be using.
Fresh Drive
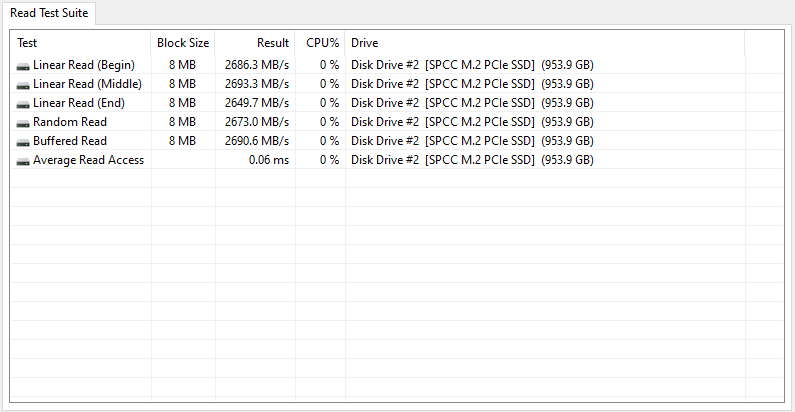
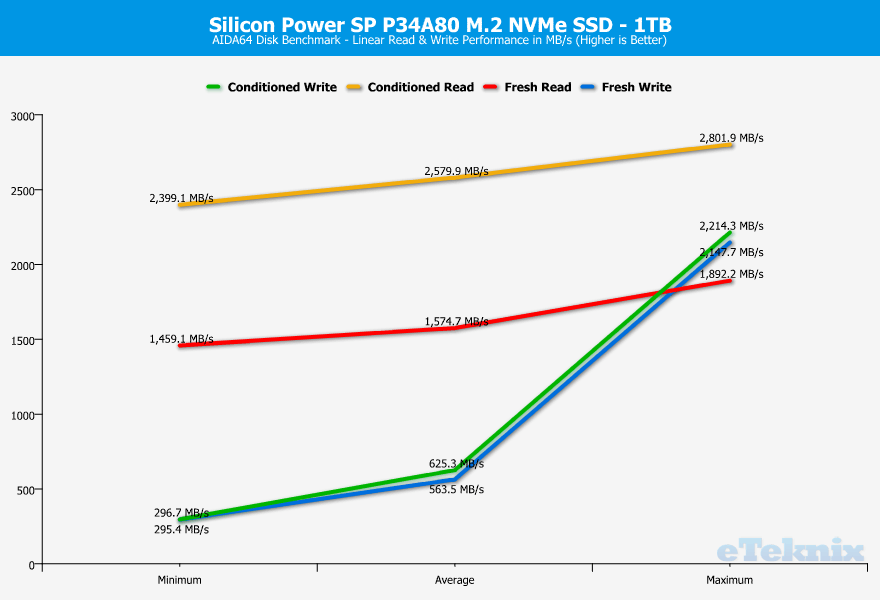
The Linear Read and Write tests measure the sequential performance by reading or writing all sectors without skipping any. It gives us a view of the drives overall performance from start to end.
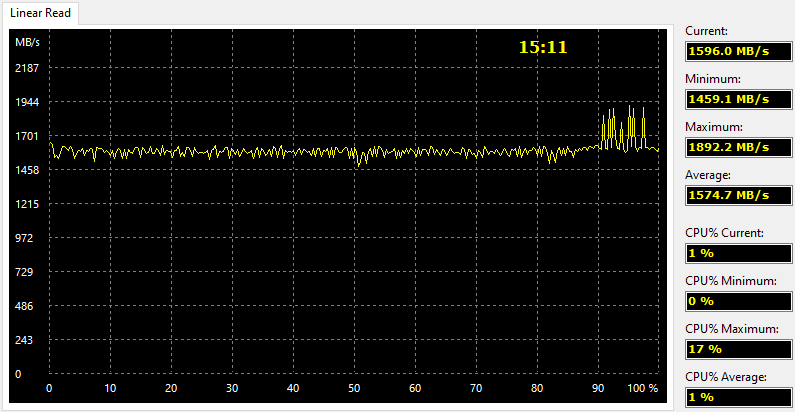
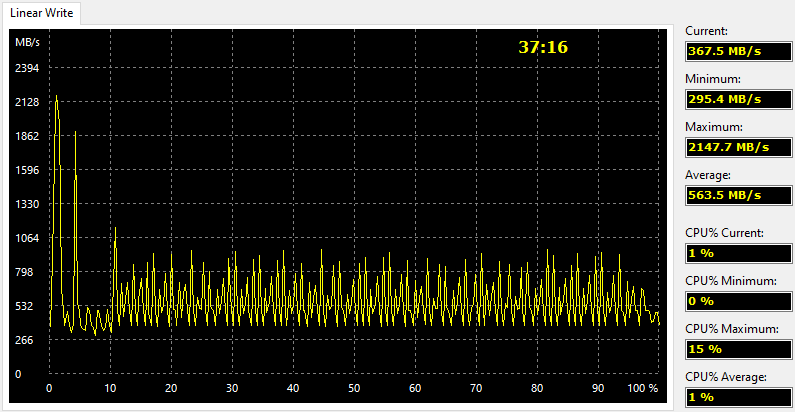
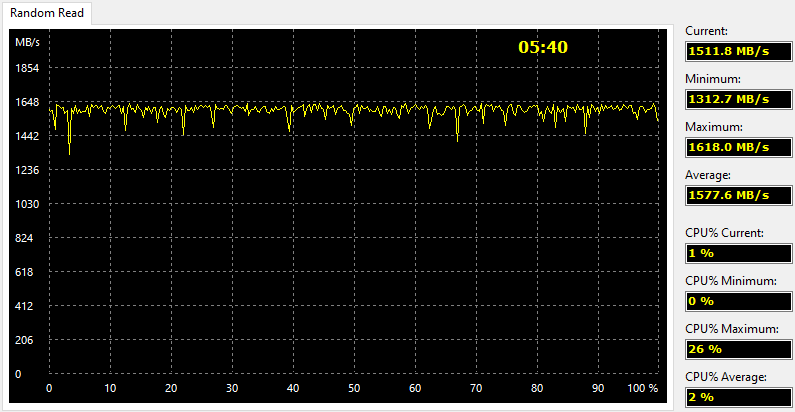
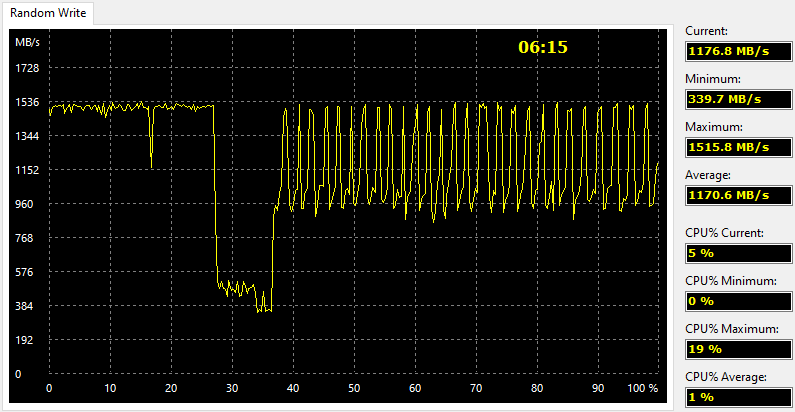
The Random Read and Write tests measure the random performance by reading or writing variable-sized data blocks at random locations on the surface of the drive. The Random tests are a combination of both speed and access times as it moves the position before each new operation.
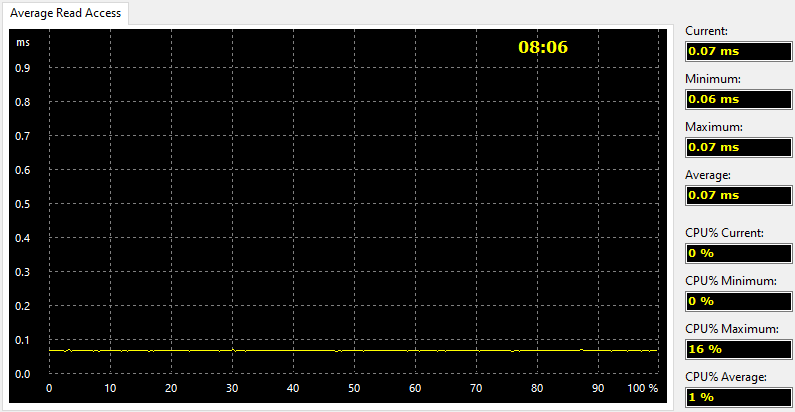
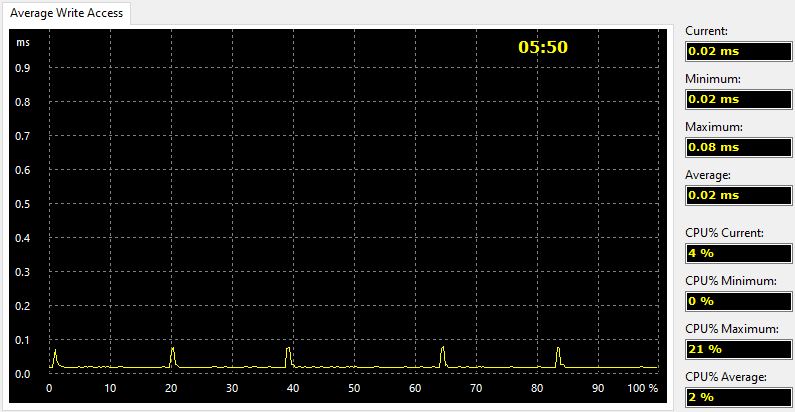
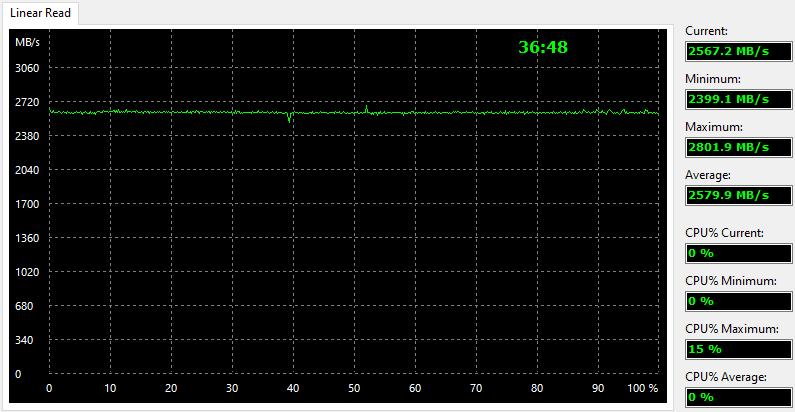
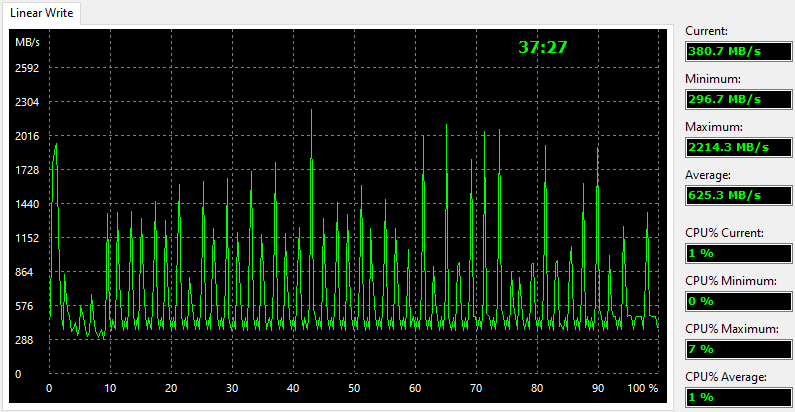
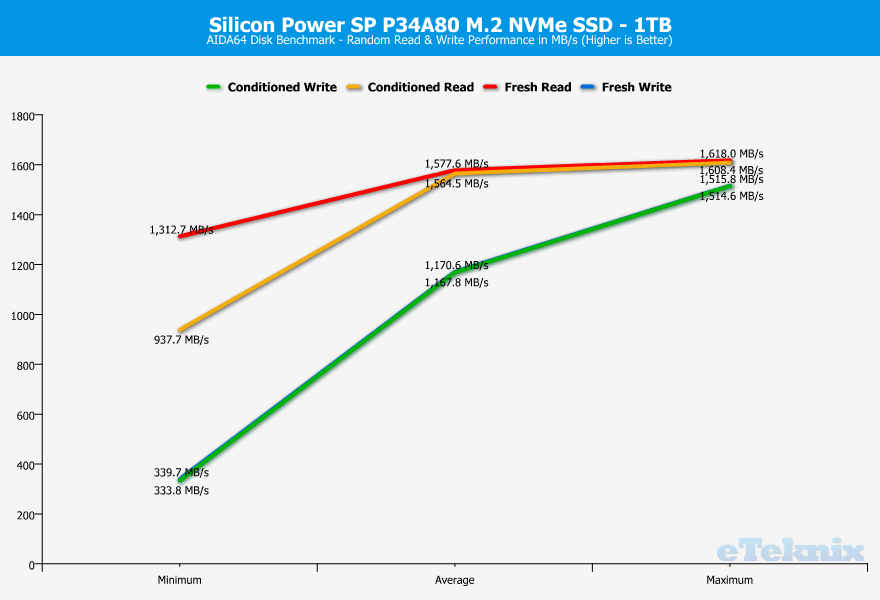
Conditioned Drive

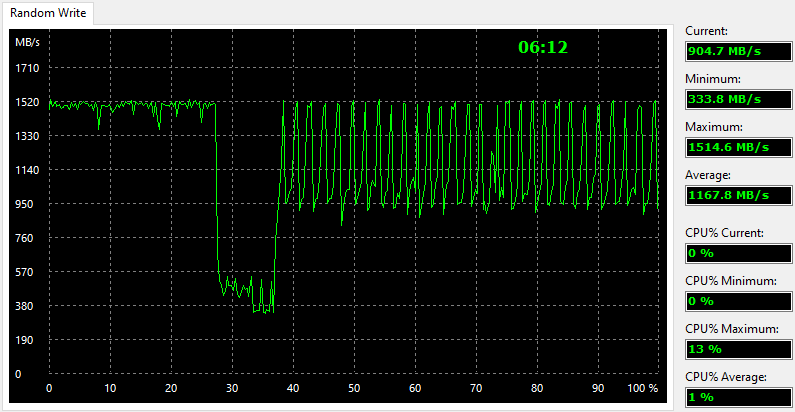
The Linear Read and Write tests measure the sequential performance by reading or writing all sectors without skipping any. It gives us a view of the drives overall performance from start to end.
The Random Read and Write tests measure the random performance by reading or writing variable-sized data blocks at random locations on the surface of the drive. The Random tests are a combination of both speed and access times as it moves the position before each new operation.

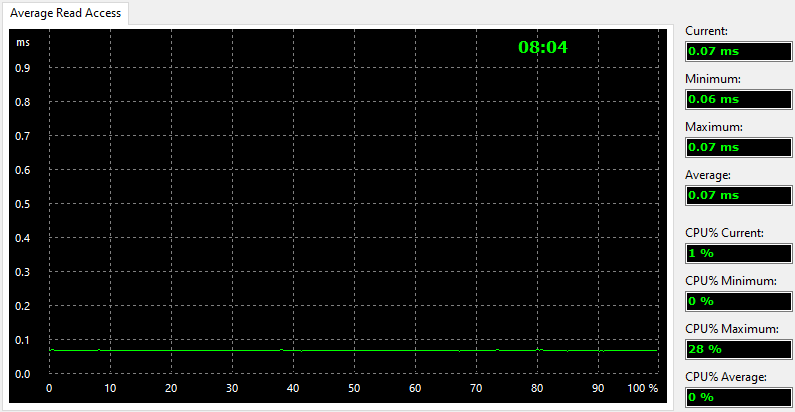
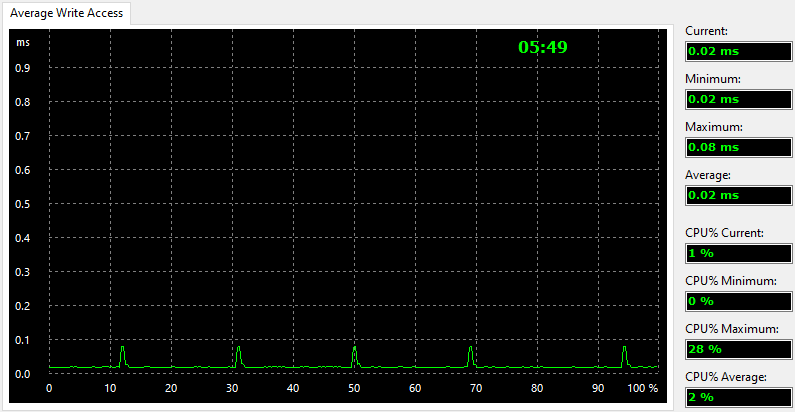
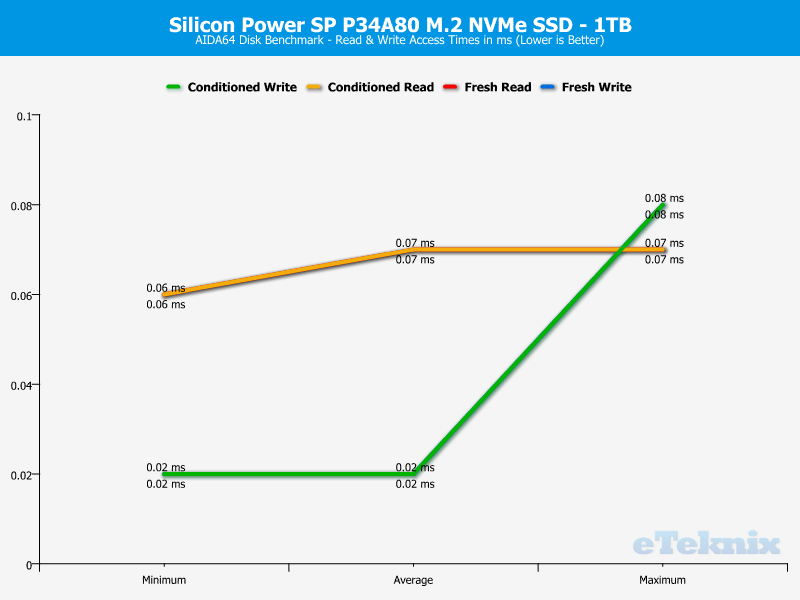
The Access time tests are designed to measure the data access performance by reading or writing small 0.5KB data blocks at random locations on the drive surface.
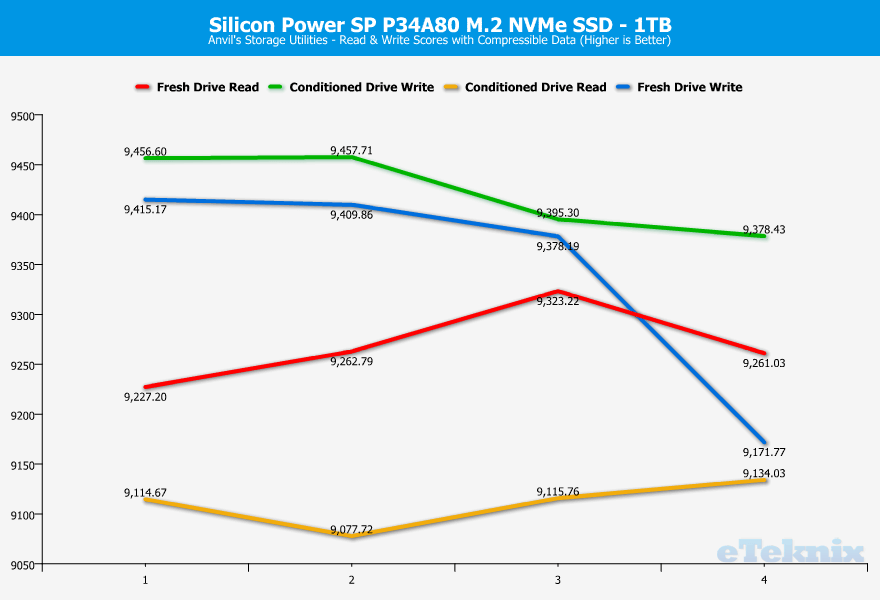
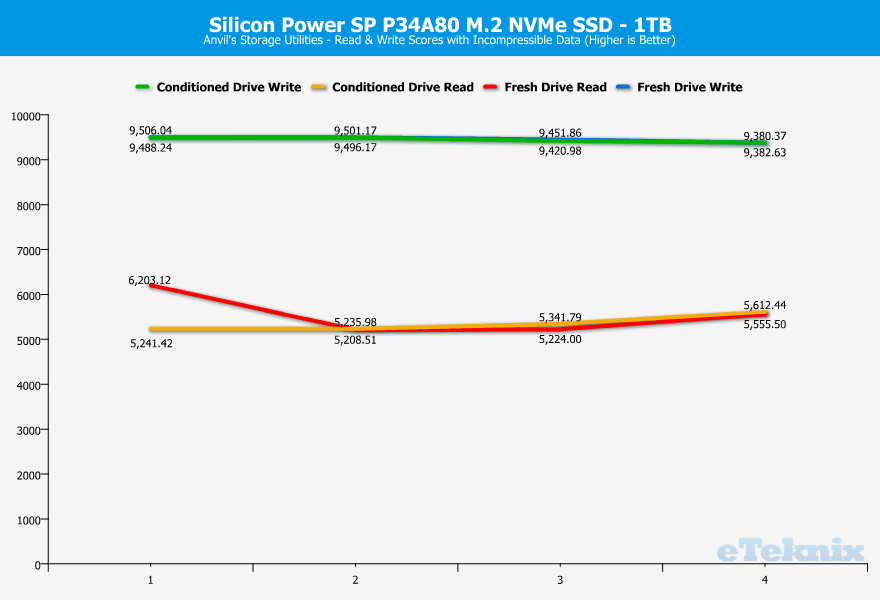
Drive Analysis
Anvil’s Storage Benchmark
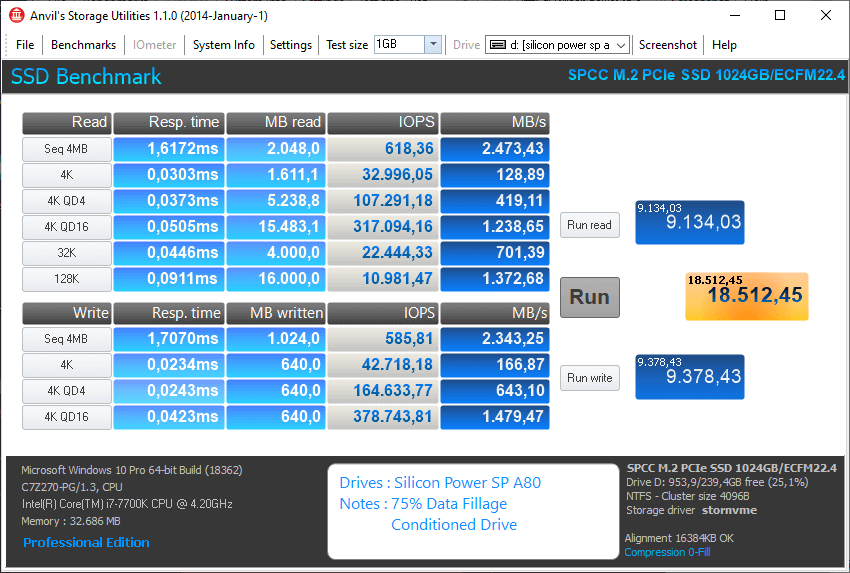
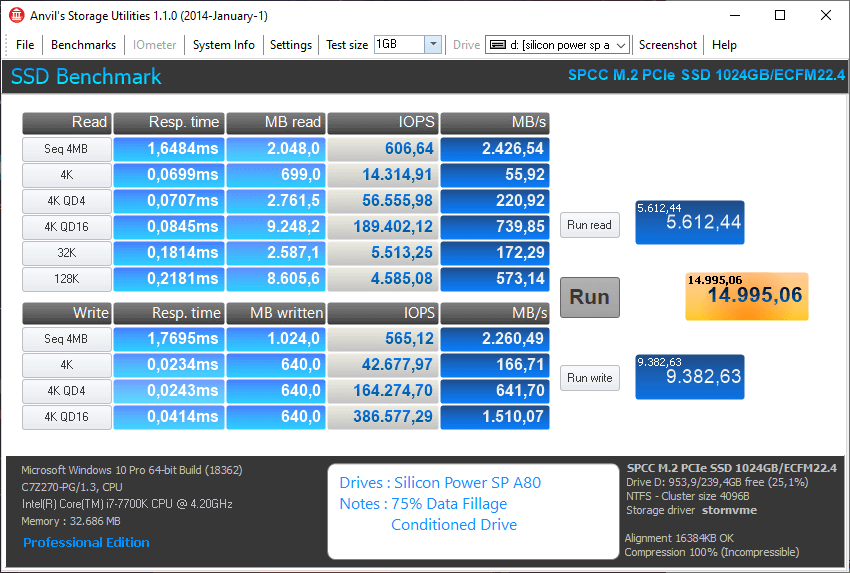
Anvil’s Storage Utilities is a complete benchmark solution used to test any writeable storage drive. It also has a drive endurance test that consistently reads and writes data to the selected medium to deliver days, months, and potentially even years of use in a shorter period.
Fresh Drive


Conditioned Drive
Drive Analysis
With the performance analysis, we get a good view of the drive’s consistency. We want as straight a line as possible for a good result.
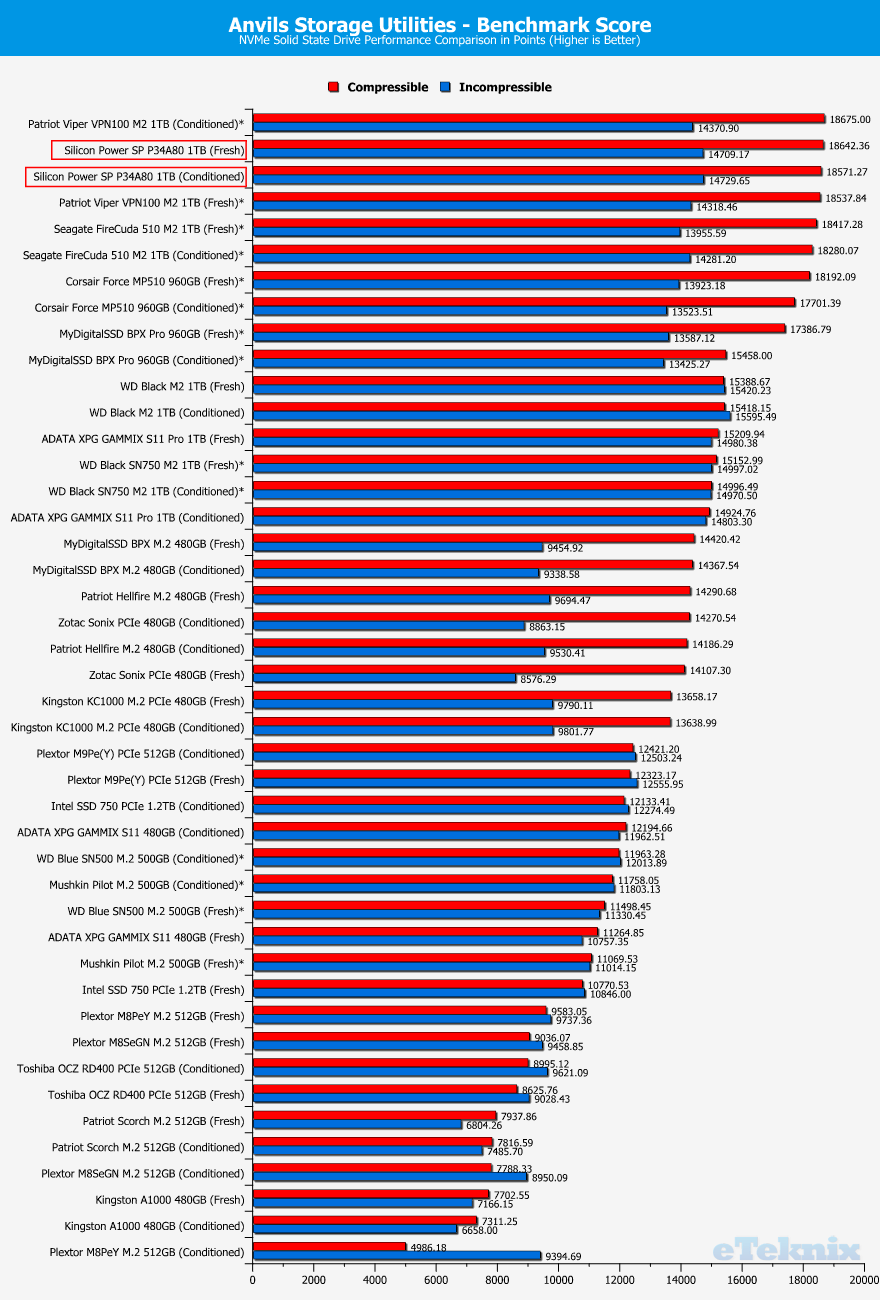
Drive Comparison
For the drive comparison, we will use the performance figures from empty drives here.
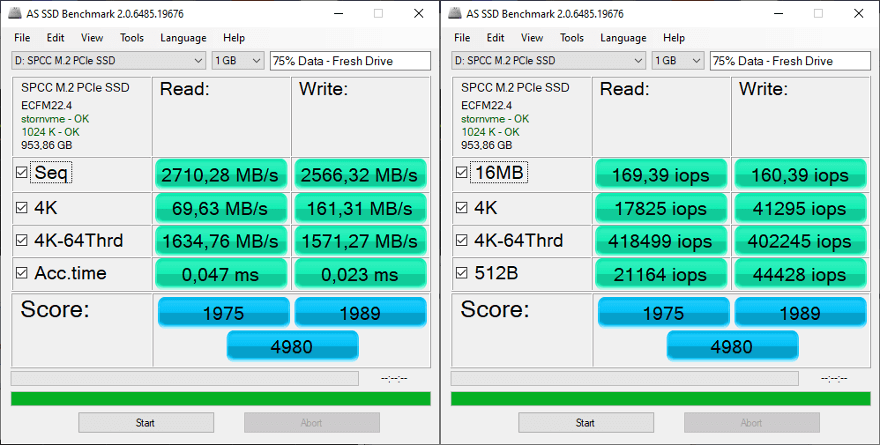
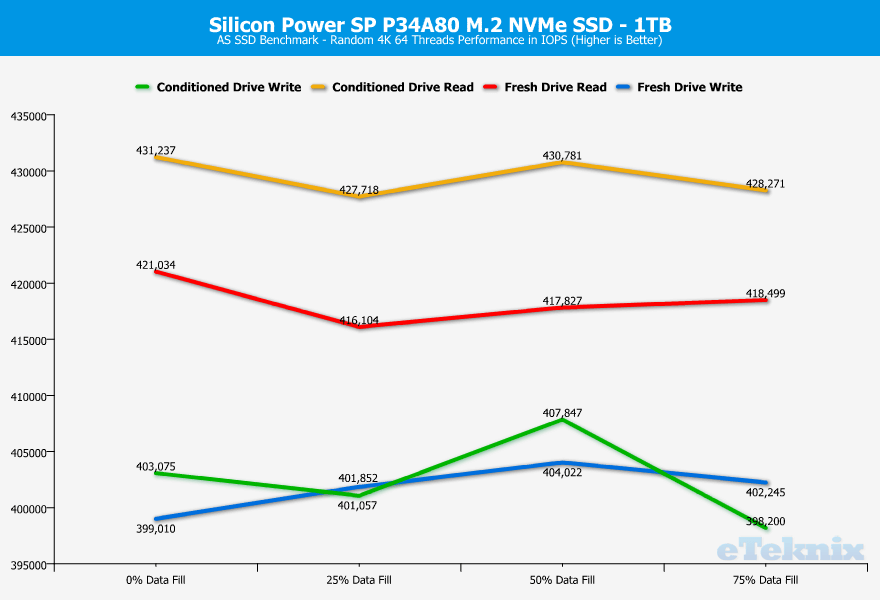
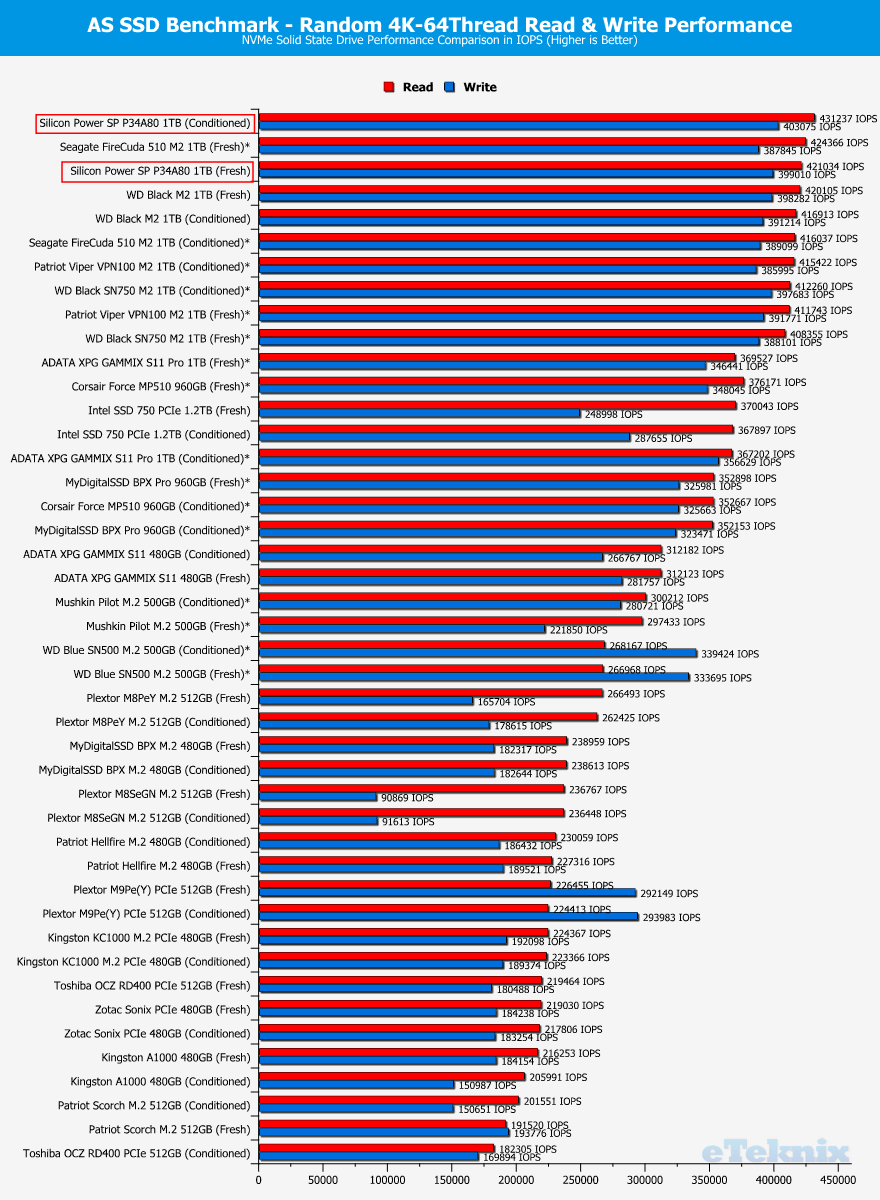
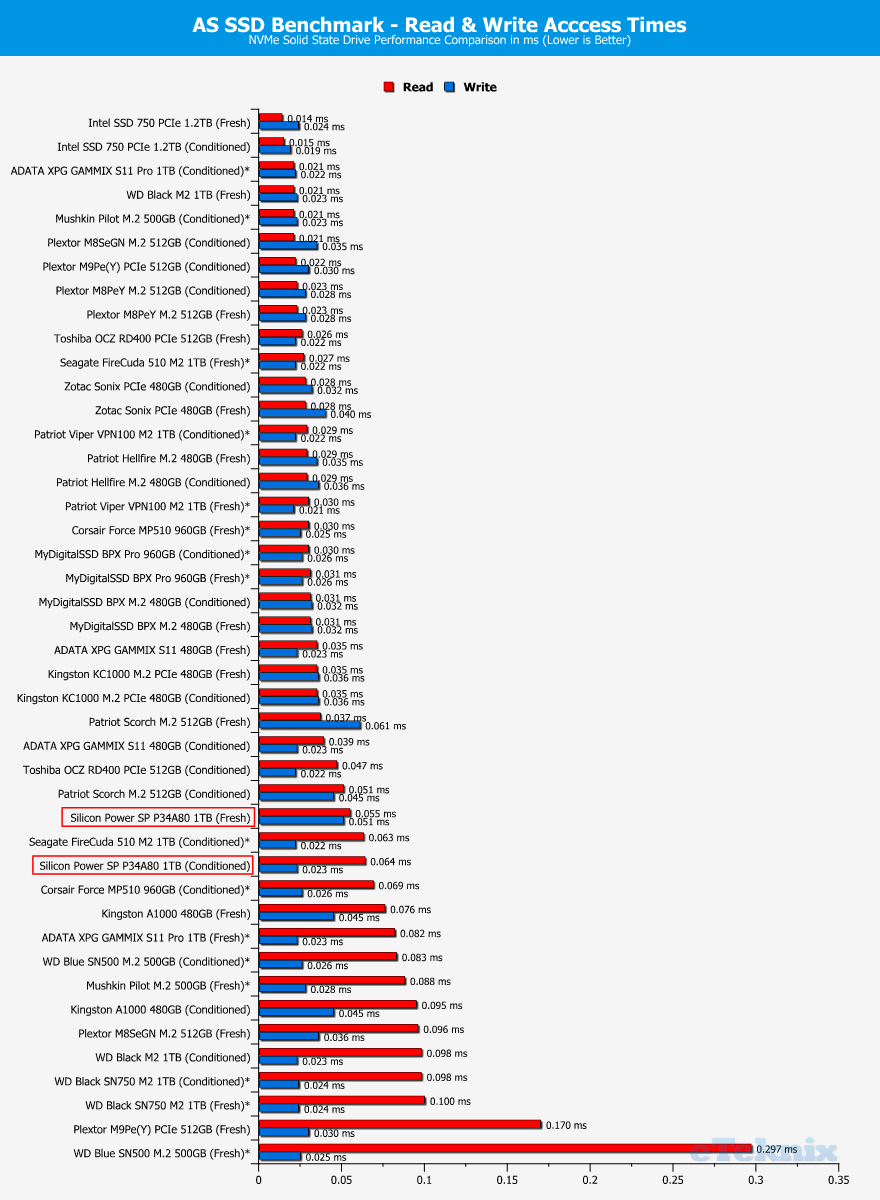
AS SSD Storage Benchmark
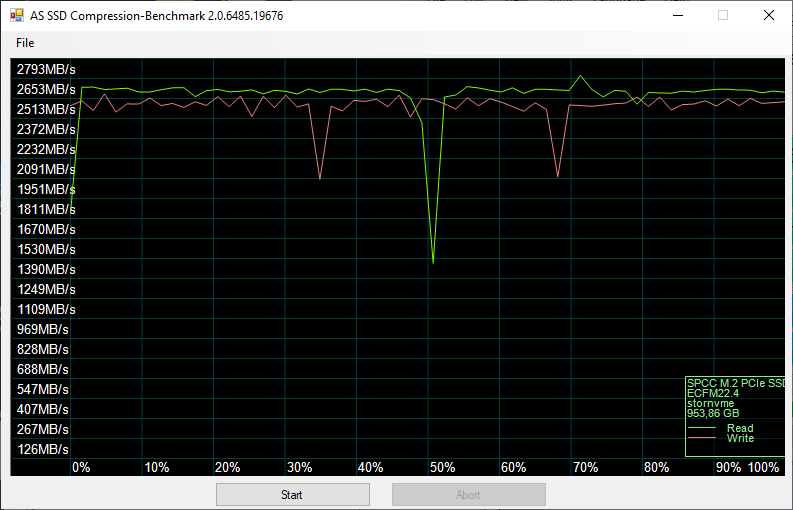
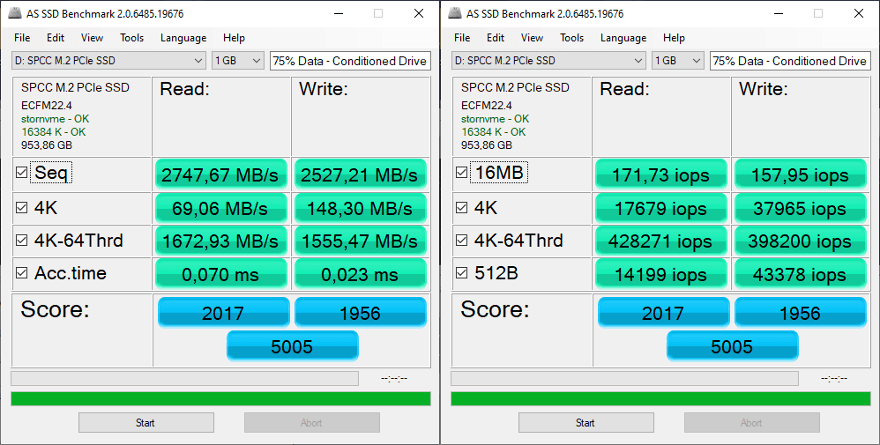
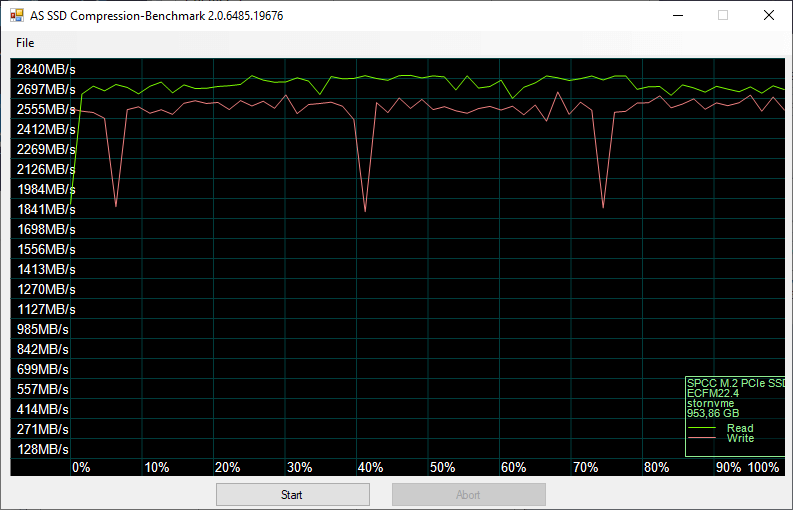
The AS SSD software determines the performance of Solid State Drives (SSD). The tool contains five synthetic and three practice tests. The synthetic tests determine the sequential and random read and write performance of the SSD, and they aren’t using the operating system cache. The copy tests are cached and as such not viable results at this time.
Fresh Drive
Conditioned Drive
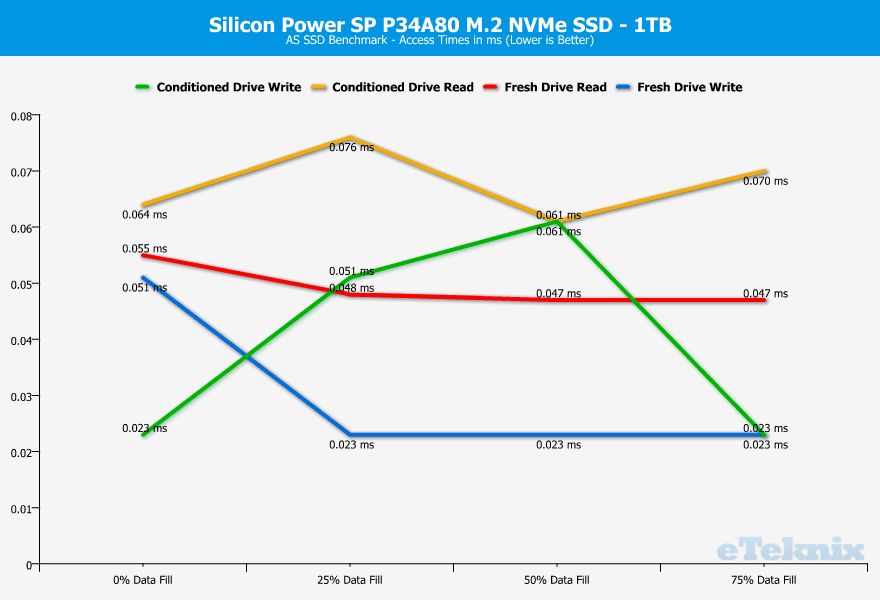
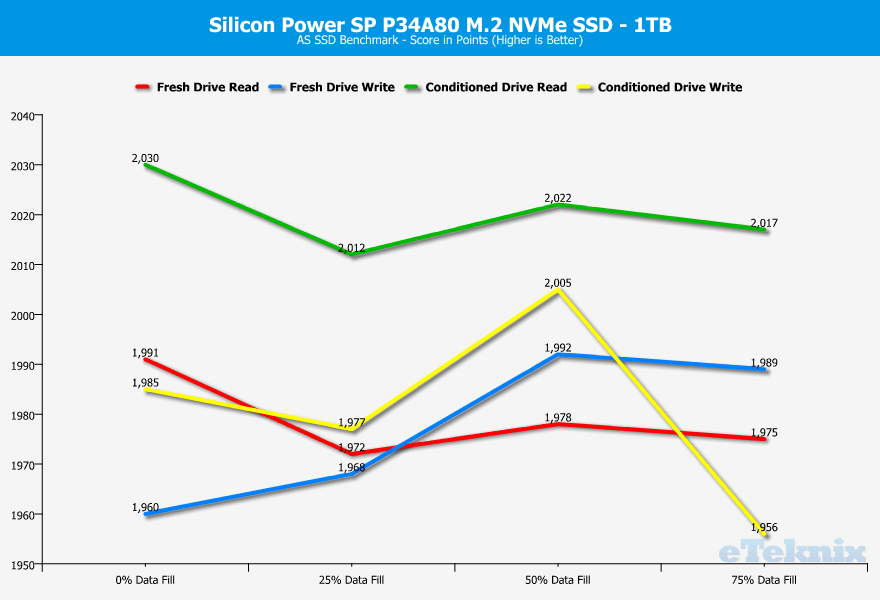
Drive Analysis
With the performance analysis, we get a good view of the drive’s consistency. We want as straight a line as possible for a good result.
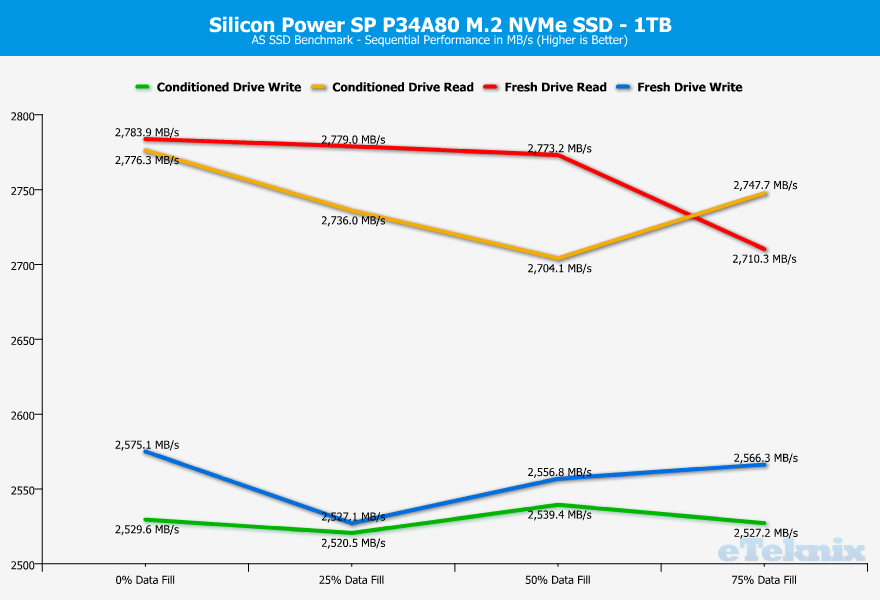
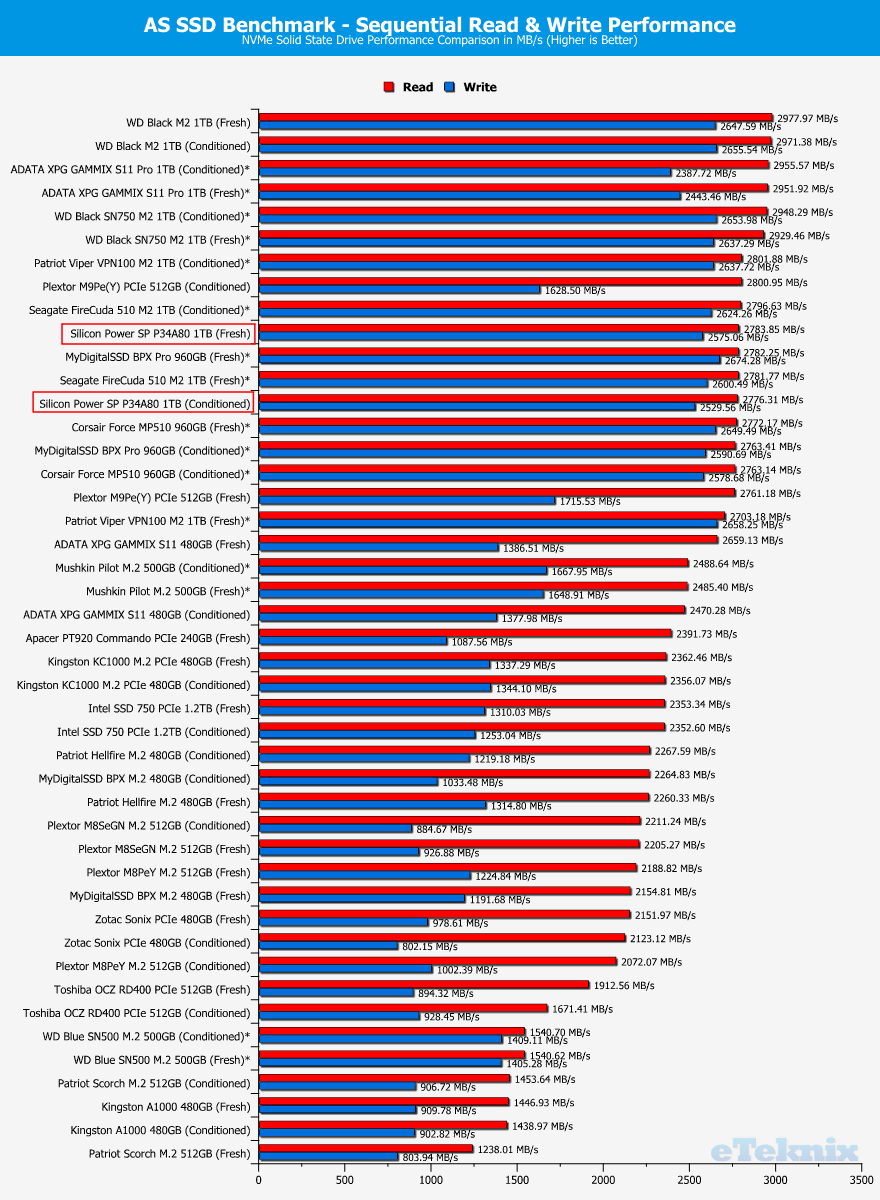
Drive Comparison
For the drive comparison, we will use the performance figures from empty drives here.

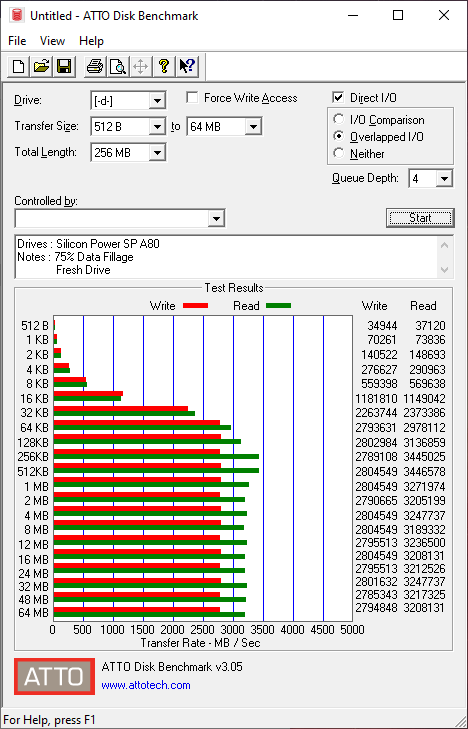
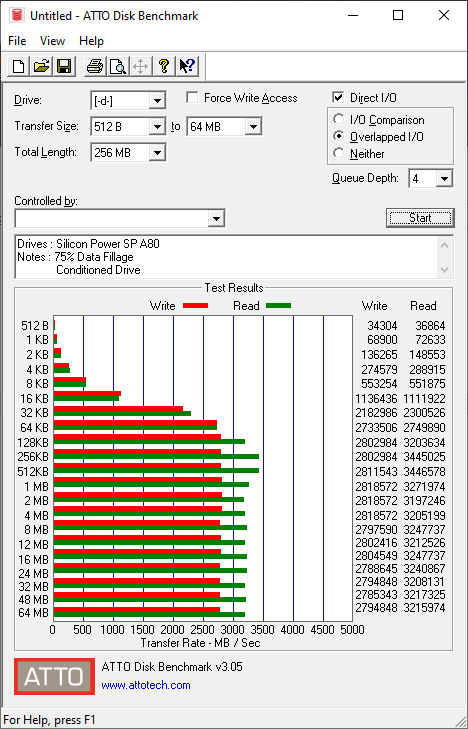
ATTO Disk Benchmark
The ATTO Disk Benchmark performance measurement tool is compatible with Microsoft Windows. Measure your storage systems performance with various transfer sizes and test lengths for reads and writes. Several options are available to customise your performance measurement including queue depth, overlapped I/O and even a comparison mode with the option to run continuously.
Fresh Drive
Conditioned Drive
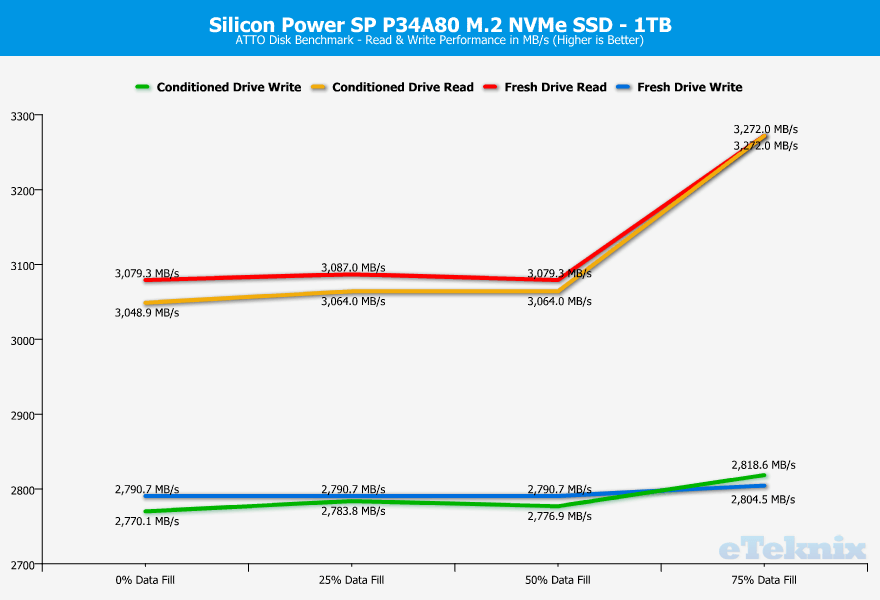
Drive Analysis
With the performance analysis, we get a good view of the drive’s consistency. We want as straight a line as possible for a good result.
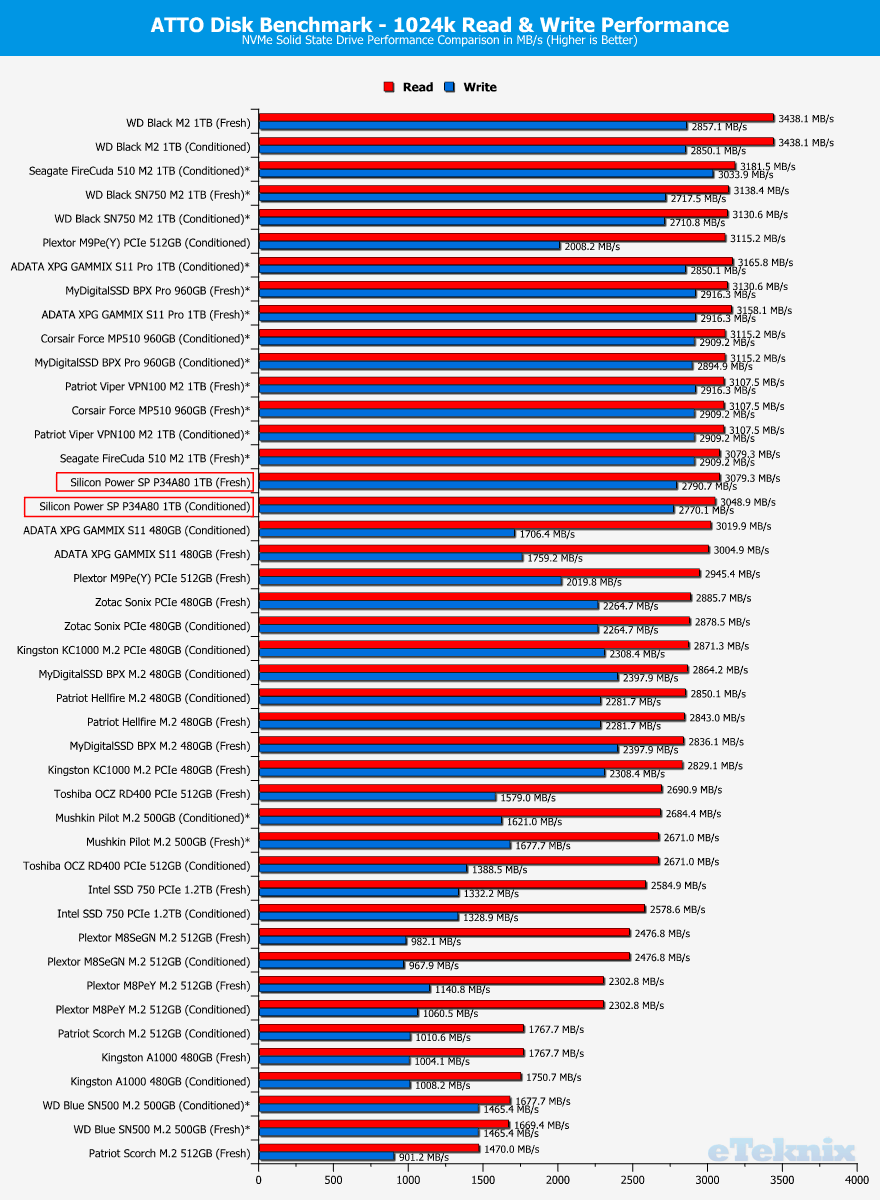
Drive Comparison
For the drive comparison, we will use the performance figures from empty drives here.
CrystalDiskMark
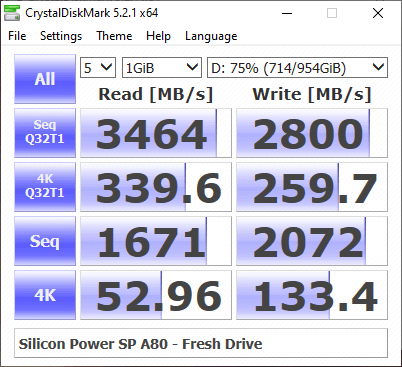
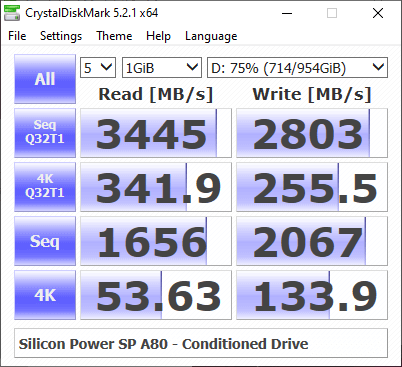
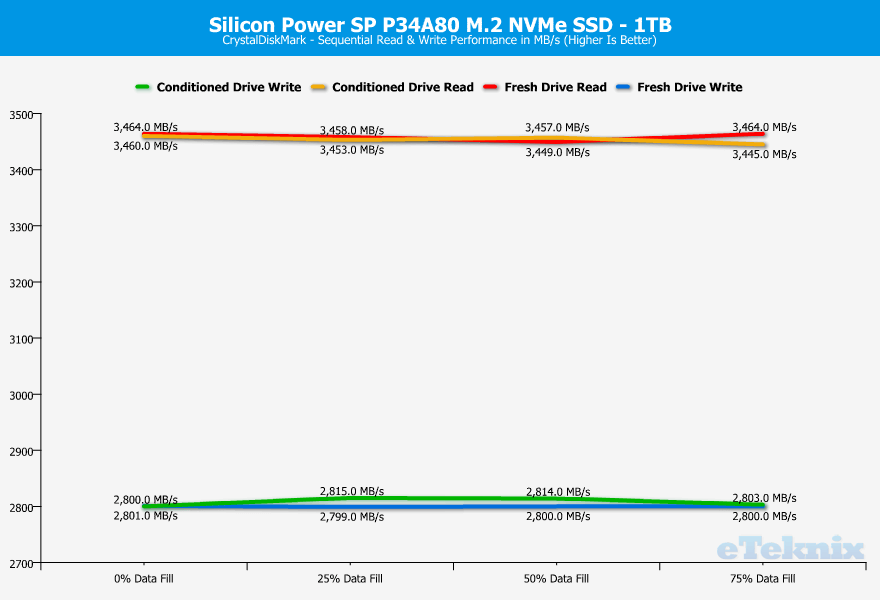
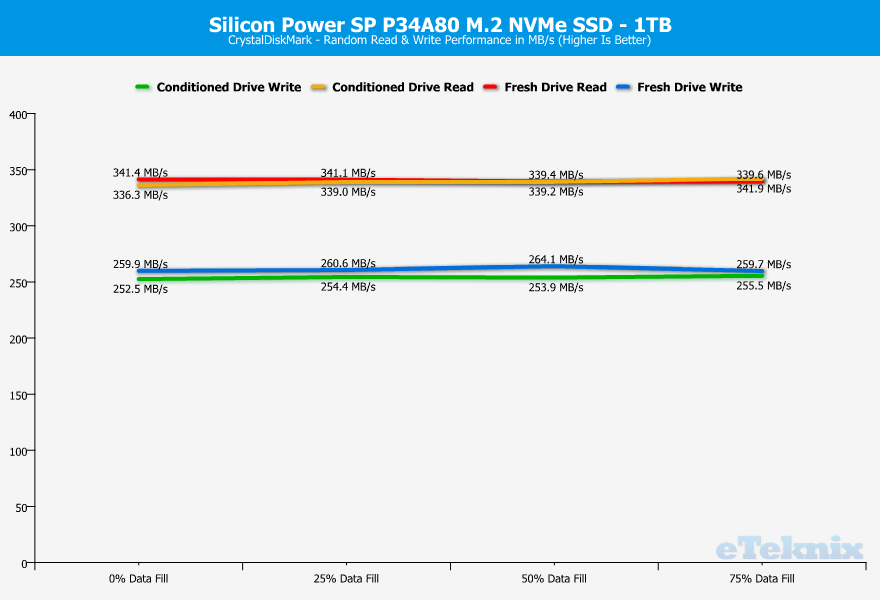
CrystalDiskMark is a small HDD and SSD benchmark utility that allows you to measure a drive’s sequential and random performance.
Fresh Drive
Conditioned Drive
Drive Analysis
With the performance analysis, we get a good view of the drive’s consistency. We want as straight a line as possible for a good result.
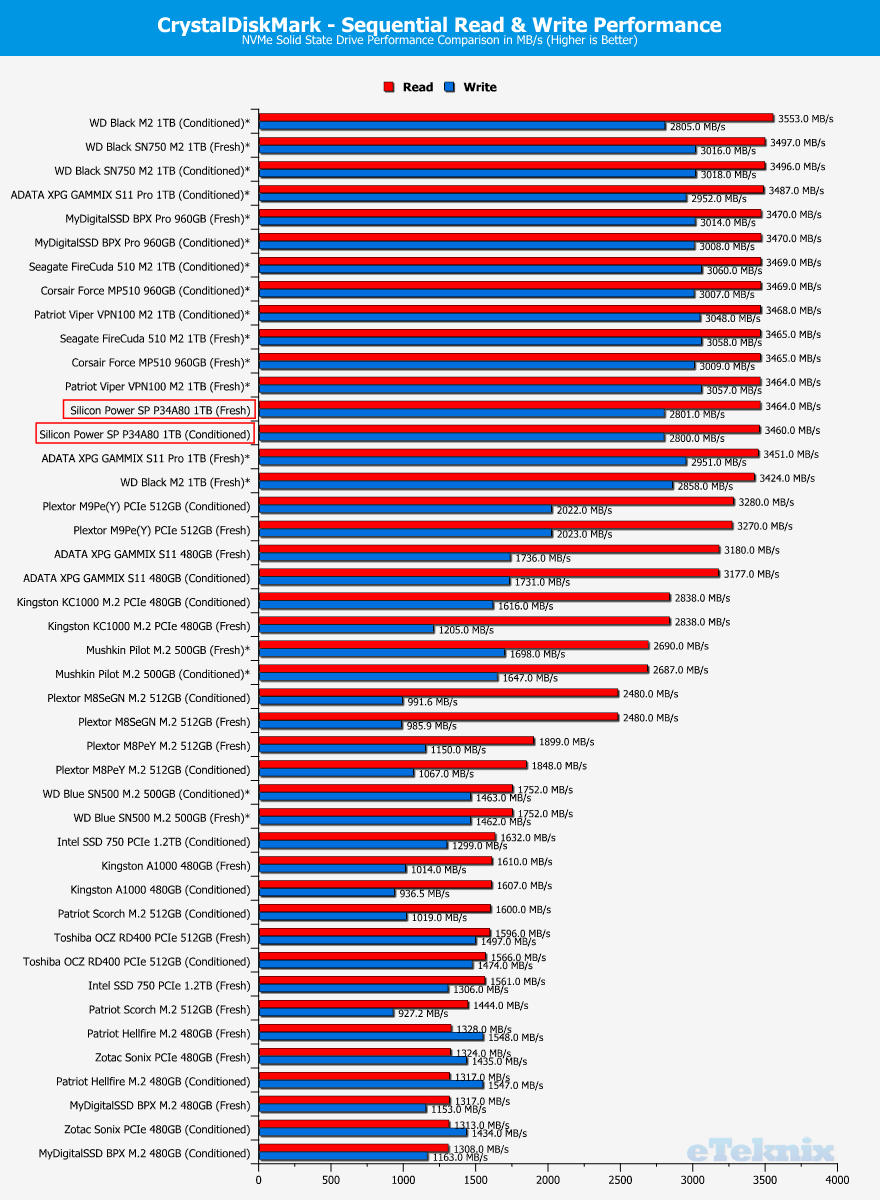
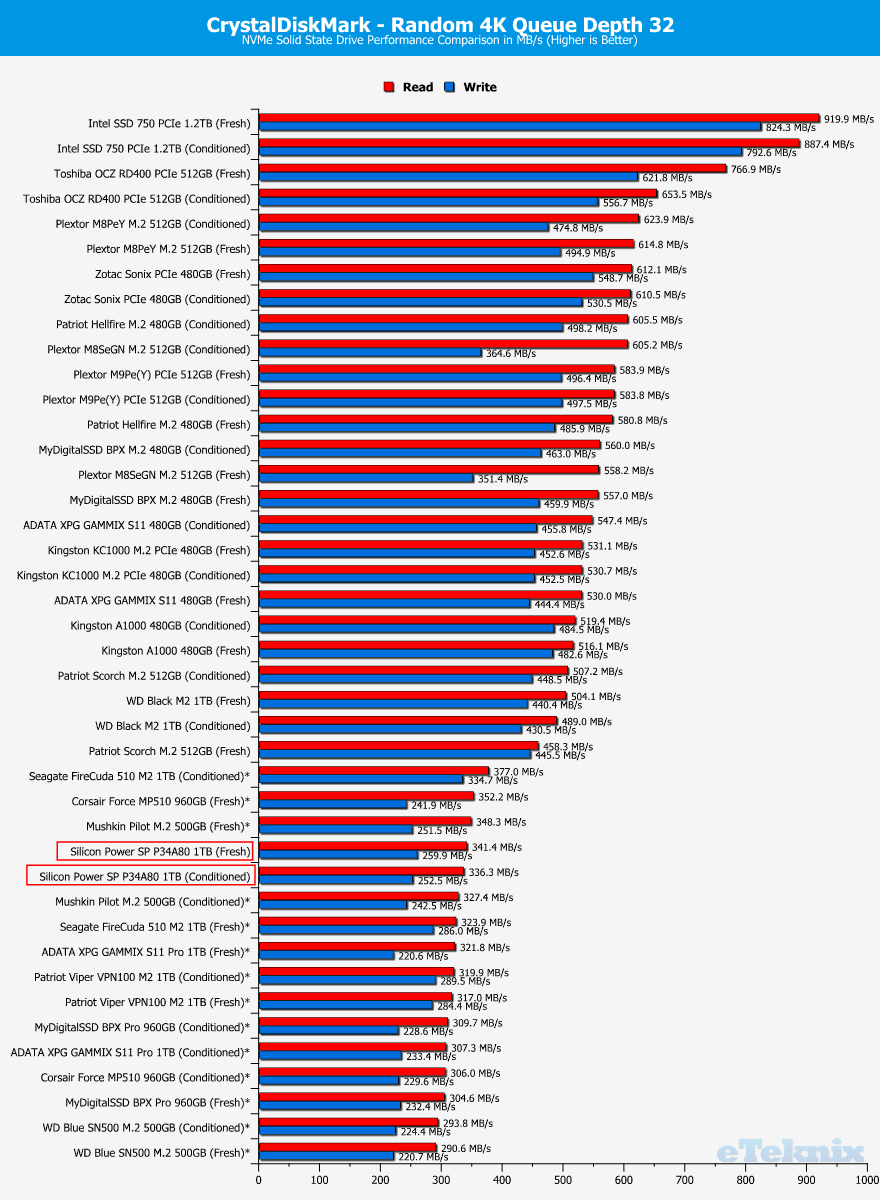
Drive Comparison
For the drive comparison, we will use the performance figures from empty drives here.
IOmeter
IOMeter is an I/O subsystem measurement and characterisation tool for single and clustered systems. As a benchmark and troubleshooting tool, it is configurable to replicate the behaviour of many popular applications. One commonly quoted measurement provided by the tool is IOPS.
Sequential Tests
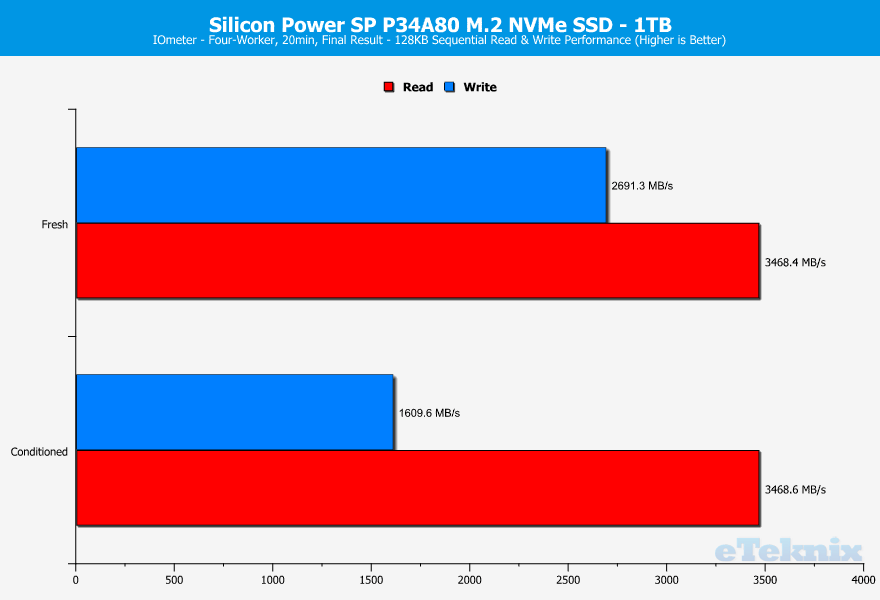
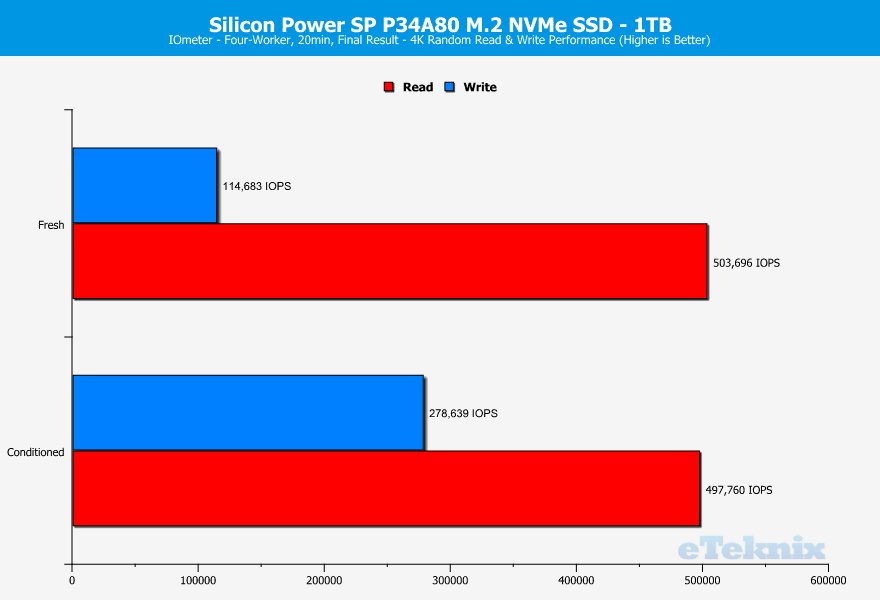
Random Tests
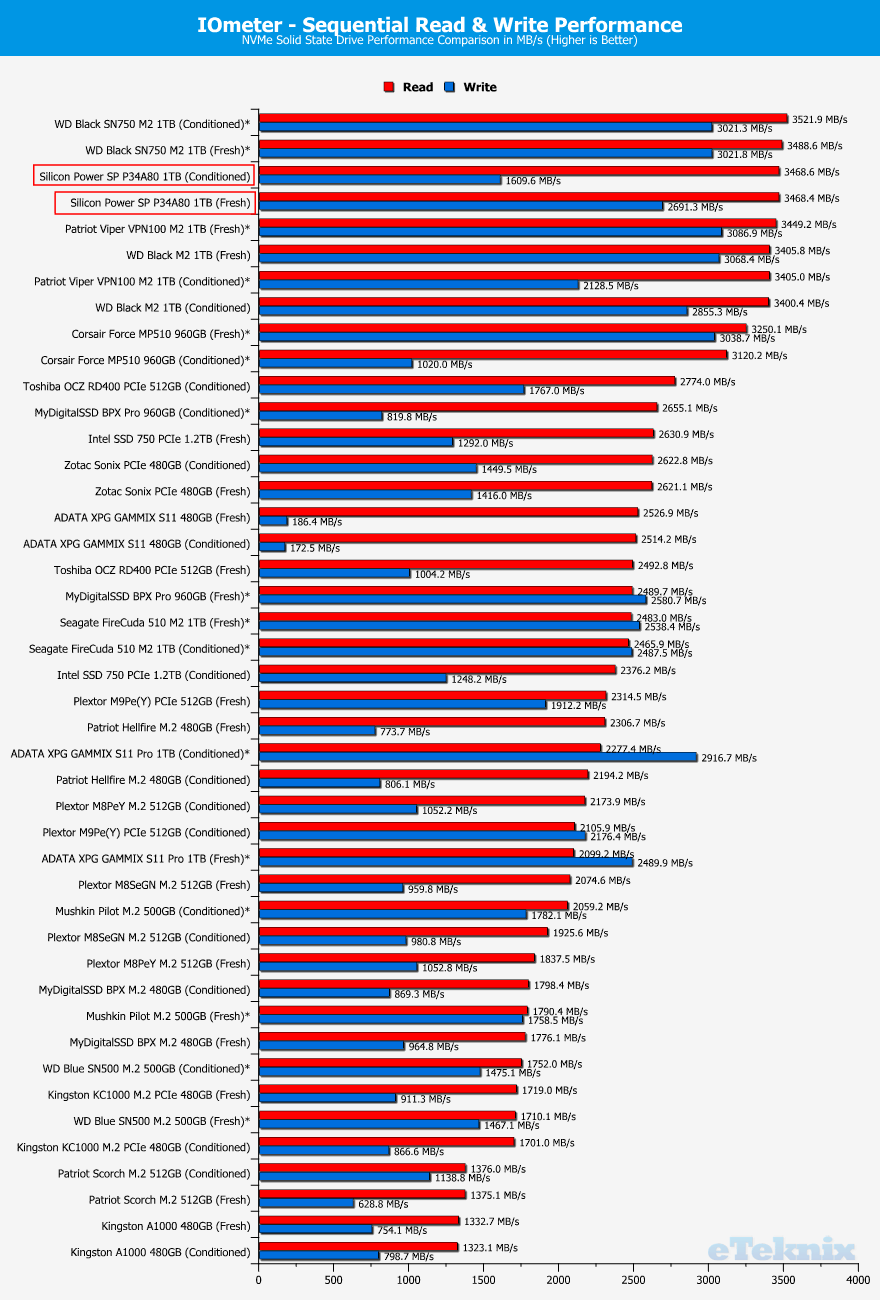
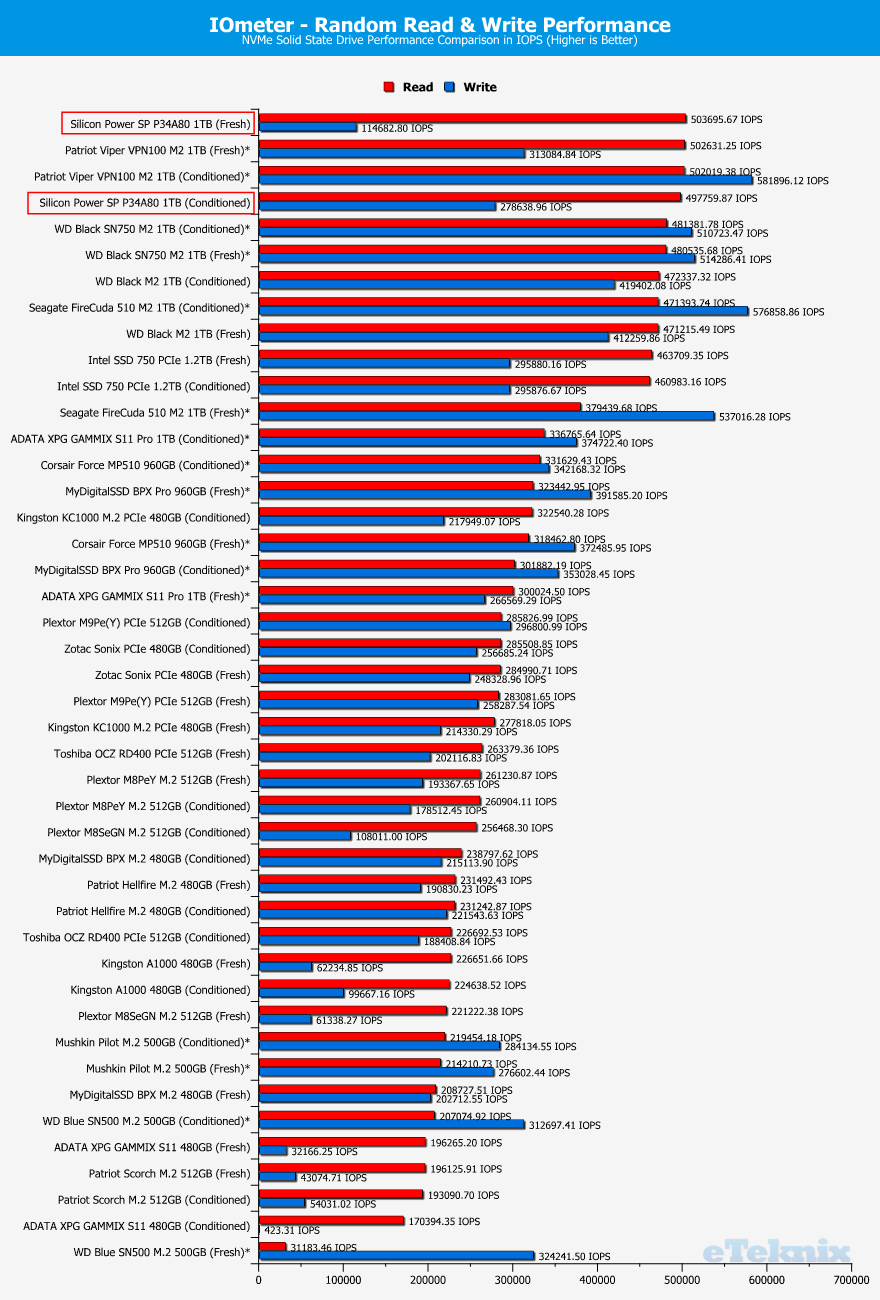
Drive Comparison
For the drive comparison, we will use the performance figures from empty drives here.
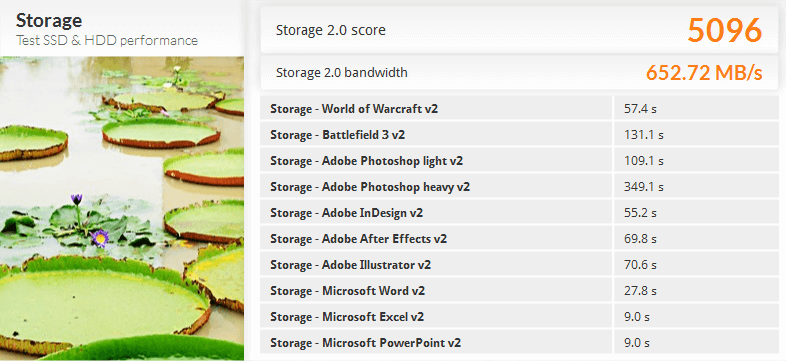
PCMark 8 Storage Benchmark
PCMark 8 Storage benchmark tests the performance of SSDs, HDDs, and SSHD hybrid drives with traces recorded from Adobe Creative Suite, Microsoft Office and a selection of games. You can test any recognised storage device, including local external drives. Unlike synthetic storage tests, the PCMark 8 Storage benchmark highlights real-world performance differences between storage devices.
Fresh Drive

Conditioned Drive
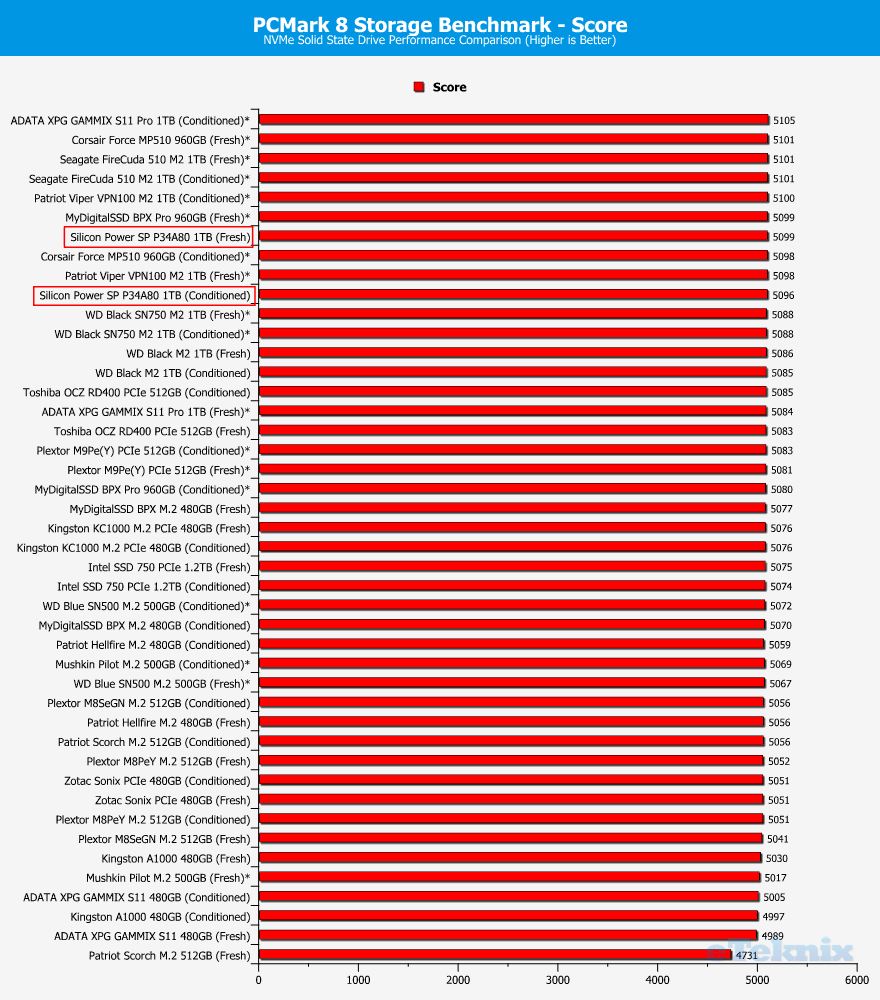
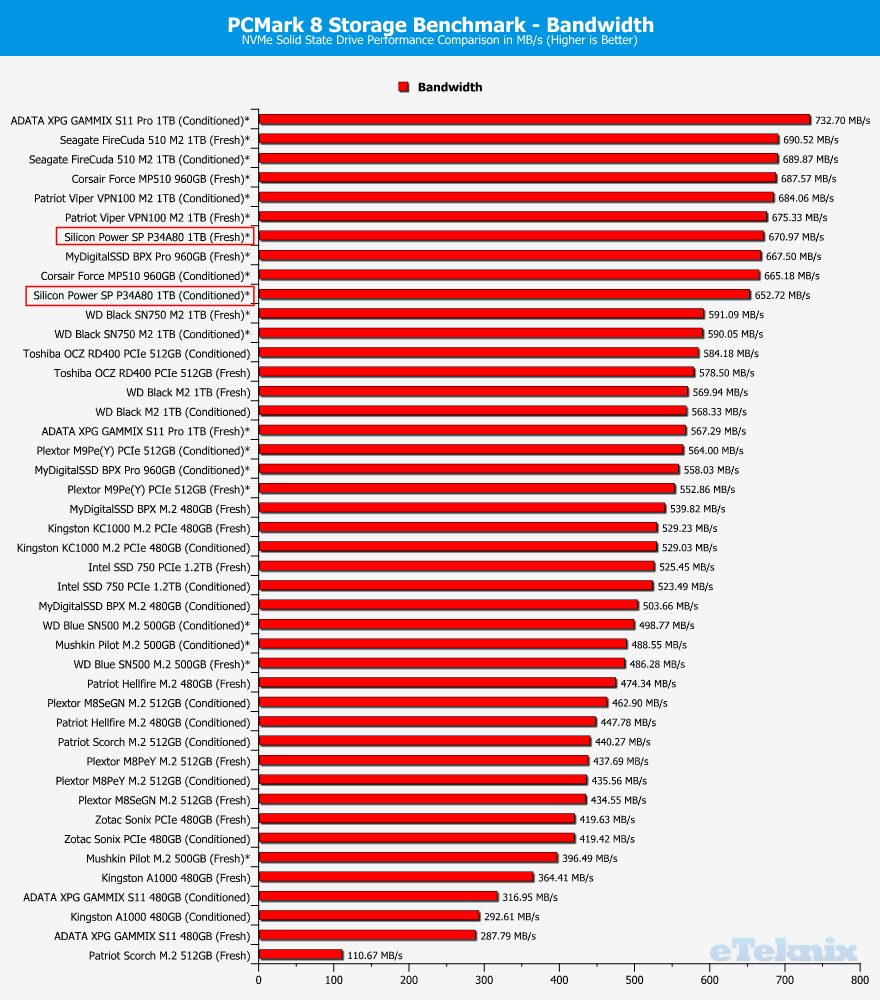
Drive Comparison
For the drive comparison, we will use the performance figures from empty drives here.
Pricing and Final Thoughts
We’ve looked at the performance, but what about the price? Getting a well-performing NVMe drive isn’t as expensive as you might think, at least not when we’re talking about the Silicon Power P34A80. The 1TB version which I’ve tested today can be yours for just £117.99 or $114.99 via Amazon. The larger 2TB model will set you back as little as £249.99 or $244.99.
Final Thoughts
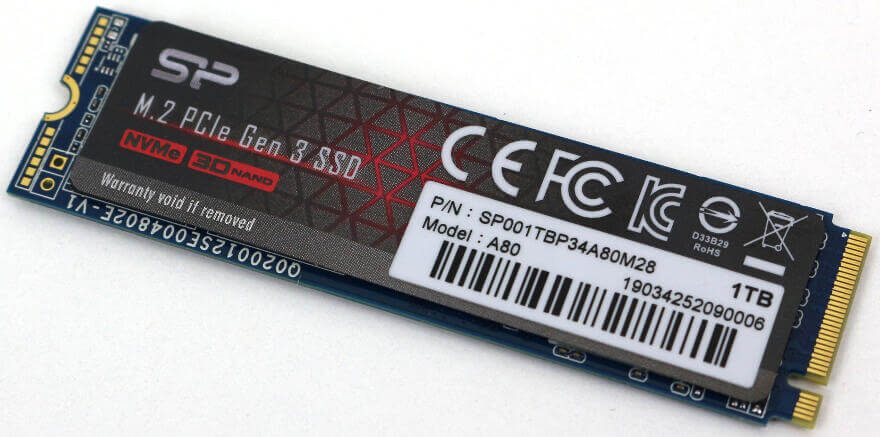
Design-wise, there isn’t a whole lot to say about the SP P34A80 from Silicon Power. It is a simple M.2 2280 module which is compatible with close to any modern system. There’s no heatsink attached to this drive which also makes it compatible for tight SFF systems and laptops. That said, the sticker on the top does look quite good with the mesh pattern. The commonly used colours, black and red, also make sure that it’ll match and look great in most systems.
Performance-wise, the SP P34A80 lands in the top end of our charts all the way through, proving that it’s built with a solid choice of components. The controller and NAND make a great pair which deliver what you want: Performance!
Feature-wise it has everything you want too. From the basic NVMe 1.3 support over the RAID engine to ordinary SMART. There’s nothing standing out here, but it covers the basics you’ll want from a drive such as the P34A80.
Should I Purchase One?
If you’re in the market for a well-performing NVMe M.2 drive, then go for it. The performance is top and it is backed by a great 5-year warranty on top of it. What’s not to like?
Pros
- Great performance
- High compatibility
- Available with up to 2TB capacity
- Affordable
Cons
- none
“Silicon Power offers a well-performing and affordable drive with the SP P34A80 which also is backed by a great 5-year warranty.”

Thank you Silicon Power for providing us with this sample.